Fig. 11.
Download original image
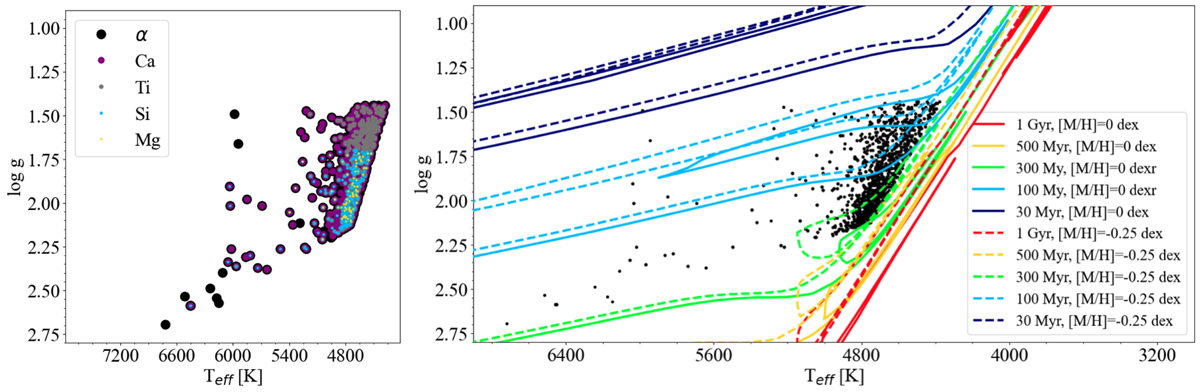
Kiel diagram of massive Gaia DR3 population. Left panel: Kiel diagram for the massive Gaia DR3 star sub-samples selected, as indicated in Sect. 4.5, for α, Ca, Mg, Si, and Ti, respectively. Different point sizes help to visualise the stars in common among different sub-samples. Right panel: PARSEC isochrones for metallicites [M/H] = 0 dex and [M/H] = −0.25 dex compared to the massive Gaia DR3 star sub-samples (black points).
Current usage metrics show cumulative count of Article Views (full-text article views including HTML views, PDF and ePub downloads, according to the available data) and Abstracts Views on Vision4Press platform.
Data correspond to usage on the plateform after 2015. The current usage metrics is available 48-96 hours after online publication and is updated daily on week days.
Initial download of the metrics may take a while.