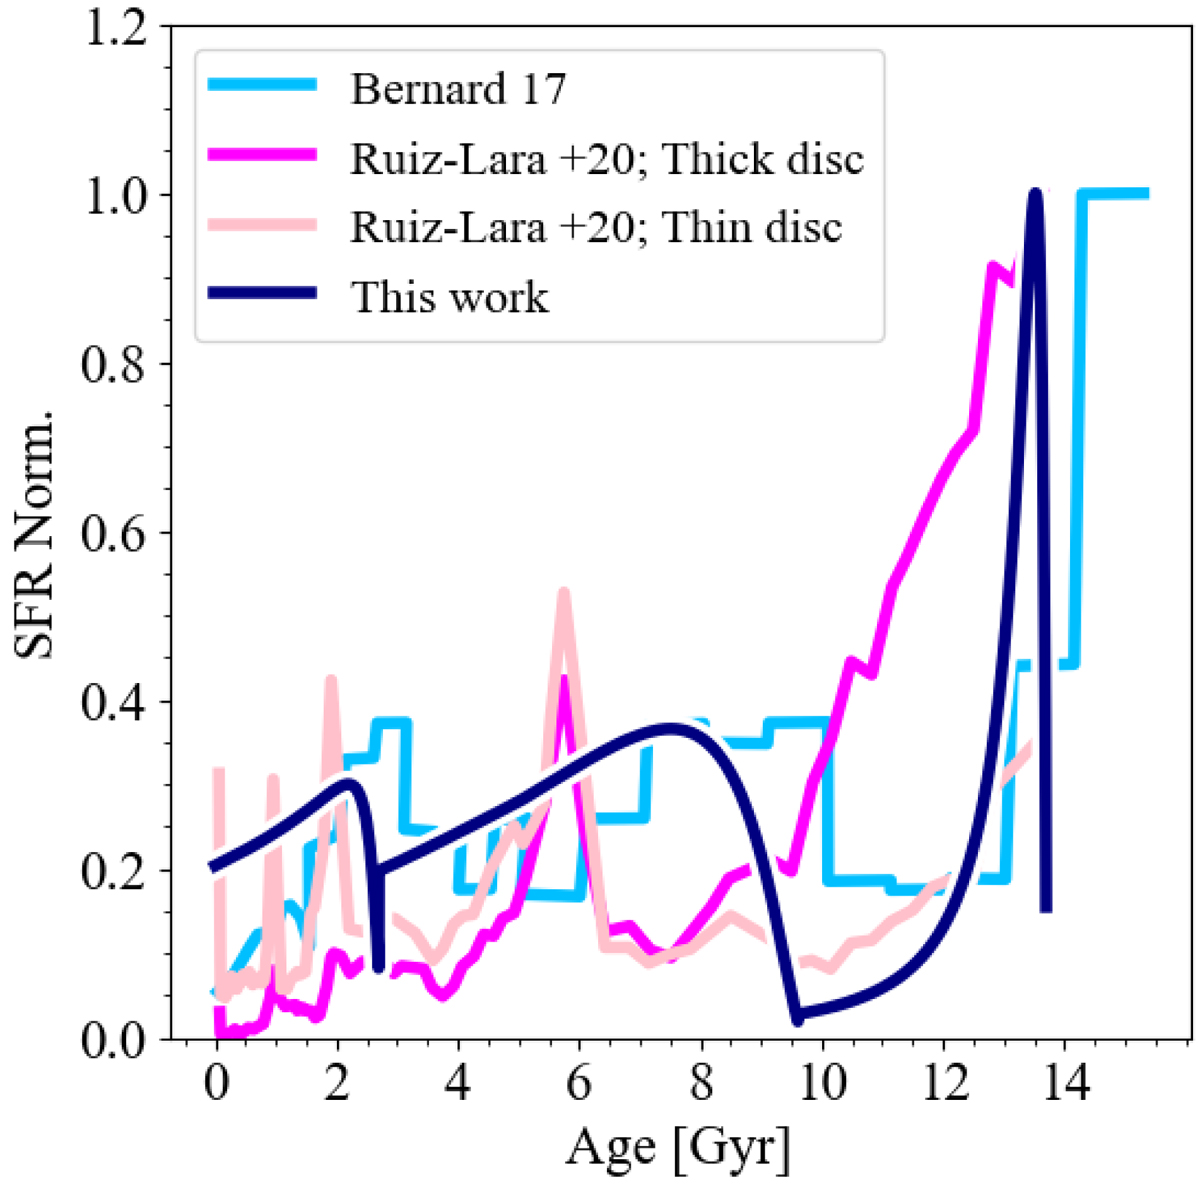
Fig. 1.
Download original image
Temporal evolution of the SFR normalised to the maximum value predicted by our model is drawn with the dark blue line. The observed estimate obtained with Gaia DR1 data is indicated by the light-blue line (Bernard 2017). The SF histories, based on the second Gaia release DR2 sby Ruiz-Lara et al. (2020), for the thick and thin discs are represented by the magenta and pink lines, respectively.
Current usage metrics show cumulative count of Article Views (full-text article views including HTML views, PDF and ePub downloads, according to the available data) and Abstracts Views on Vision4Press platform.
Data correspond to usage on the plateform after 2015. The current usage metrics is available 48-96 hours after online publication and is updated daily on week days.
Initial download of the metrics may take a while.