Fig. 6

Download original image
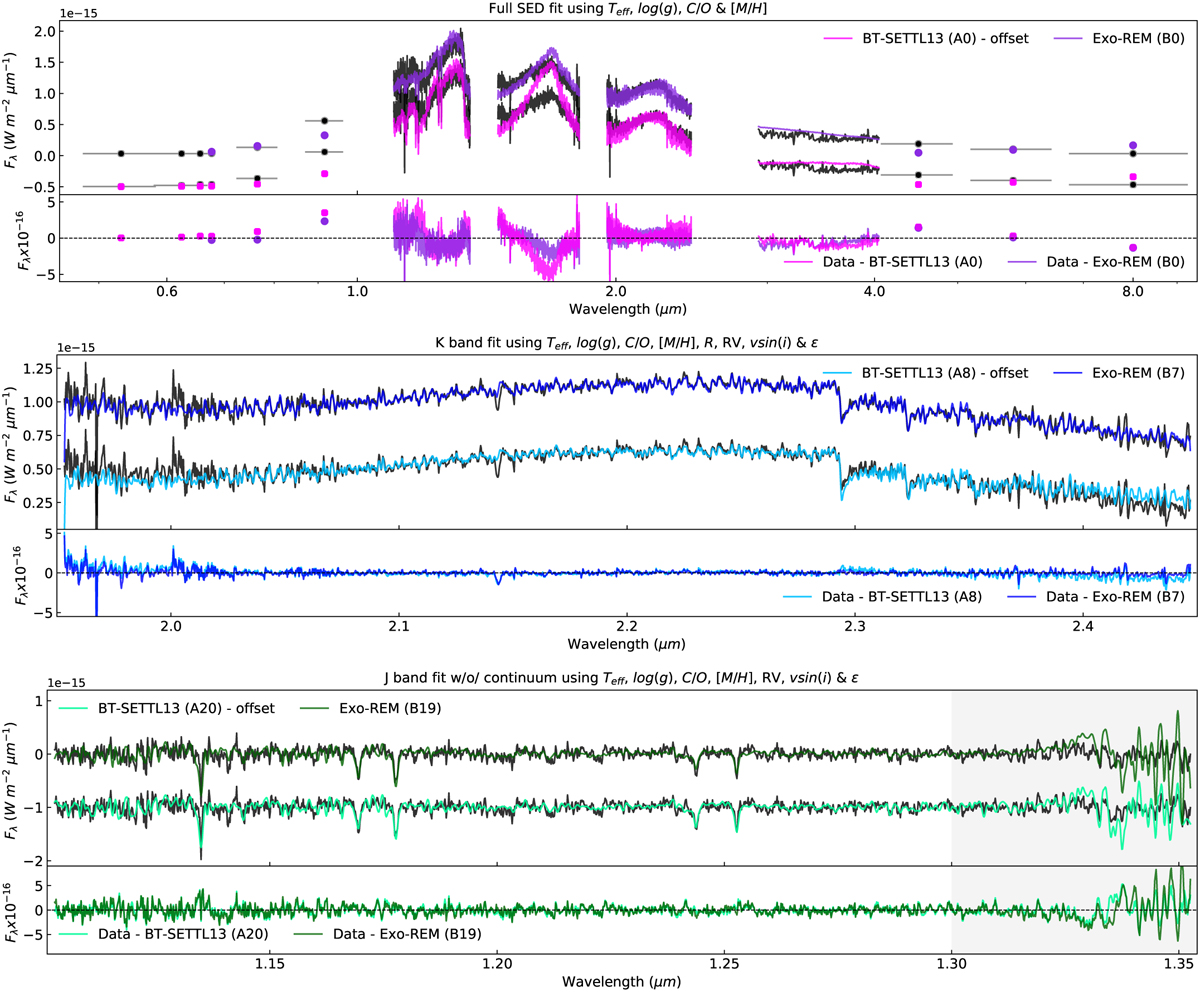
Best atmospheric models. Top: full SED fit for both families of atmospheric models and the (data-model) residuals. An offset was applied to the BT-SETTL13 model. Middle: same as the top but for the K band only. Bottom: same as the top but for the J band modeled without the continuum. Here, the gray area (> 1.3 µm) shows the spectral region excluded from the fit. Each model is identifiable by the label with the numeration of Tables B.1 and B.2. The colors are consistent with the corner plots (Figs. 7 and 8) and the tables.
Current usage metrics show cumulative count of Article Views (full-text article views including HTML views, PDF and ePub downloads, according to the available data) and Abstracts Views on Vision4Press platform.
Data correspond to usage on the plateform after 2015. The current usage metrics is available 48-96 hours after online publication and is updated daily on week days.
Initial download of the metrics may take a while.


