Fig. 5

Download original image
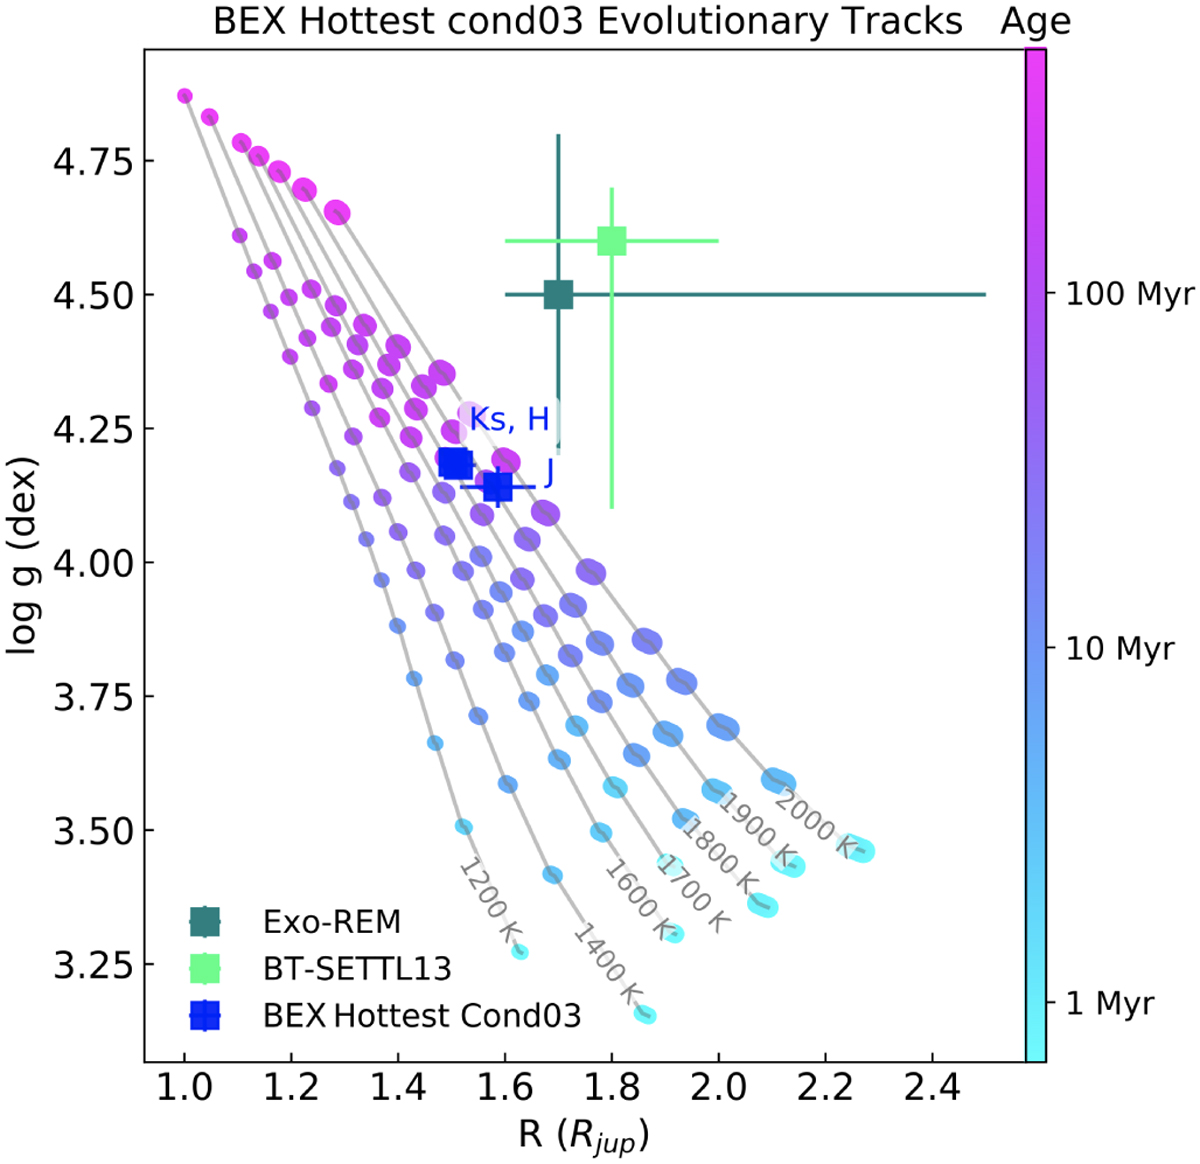
Radius vs. gravity as a function of age and effective temperature from the BEX Hottest cond03 evolutionary models. The color scale traces the ages on a logarithmic scale, and iso-temperature curves are labeled. The estimated position in the diagram for AB Pic b is reported for (i) the evolutionary model prediction (blue) from the BEX Hottest cond03 models using the absolute magnitudes from NaCo in the J, H, and K band (Chauvin et al. 2005) and (ii) the ForMoSA predictions (green) from our adopted values for both families of atmospheric models implemented (see Sect. 4.3).
Current usage metrics show cumulative count of Article Views (full-text article views including HTML views, PDF and ePub downloads, according to the available data) and Abstracts Views on Vision4Press platform.
Data correspond to usage on the plateform after 2015. The current usage metrics is available 48-96 hours after online publication and is updated daily on week days.
Initial download of the metrics may take a while.


