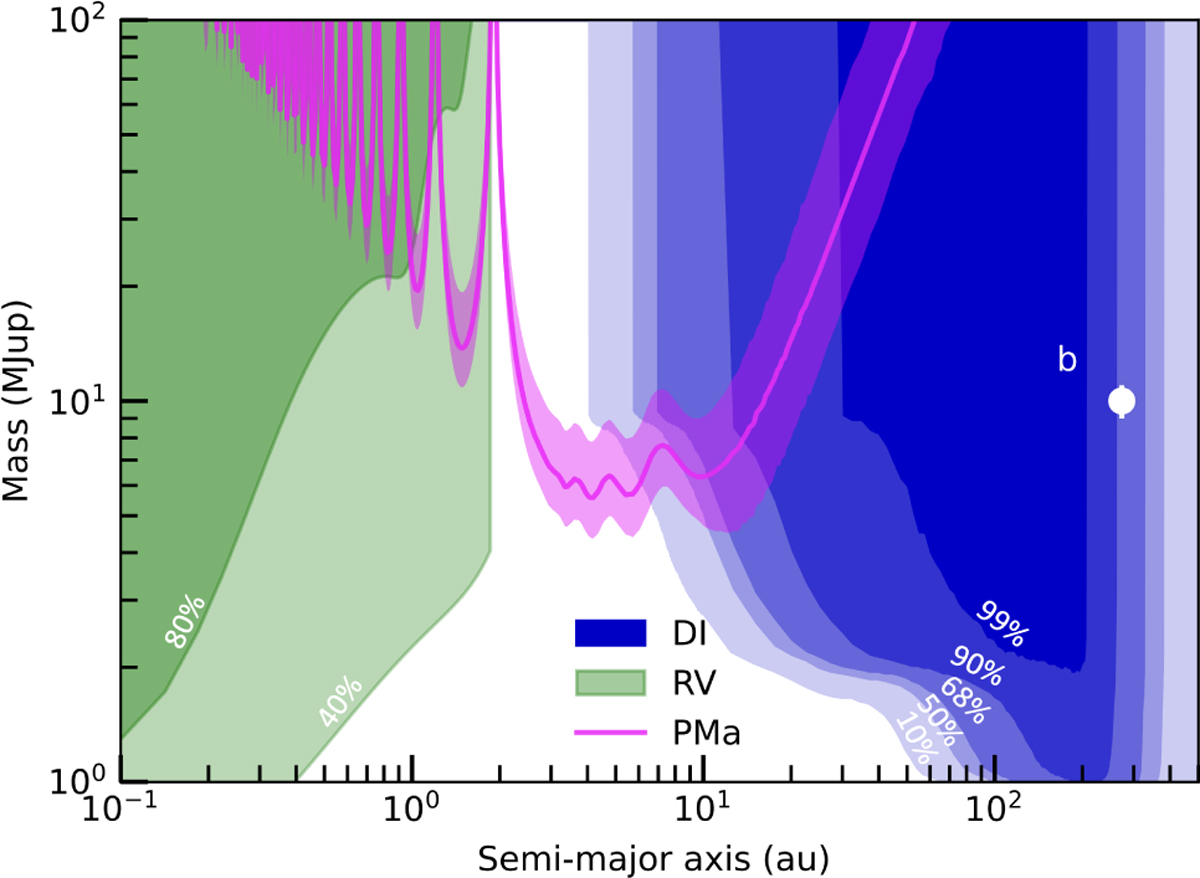
Fig. 11

Download original image
Mass detection limits for an inner planet without assuming coplanarity with AB Pic b. The pink curve shows the estimated mass and orbital distance from the HIPPARCOS–Gaia proper motion anomaly (PMa), the blue area represents the SPHERE detection limits (DI), and the green area represents the RV detection limits from Grandjean et al. (2020) to give a rough idea of the inner regions that we can exclude. The semi-major axis and mass of AB Pic b are show by the white point.
Current usage metrics show cumulative count of Article Views (full-text article views including HTML views, PDF and ePub downloads, according to the available data) and Abstracts Views on Vision4Press platform.
Data correspond to usage on the plateform after 2015. The current usage metrics is available 48-96 hours after online publication and is updated daily on week days.
Initial download of the metrics may take a while.


