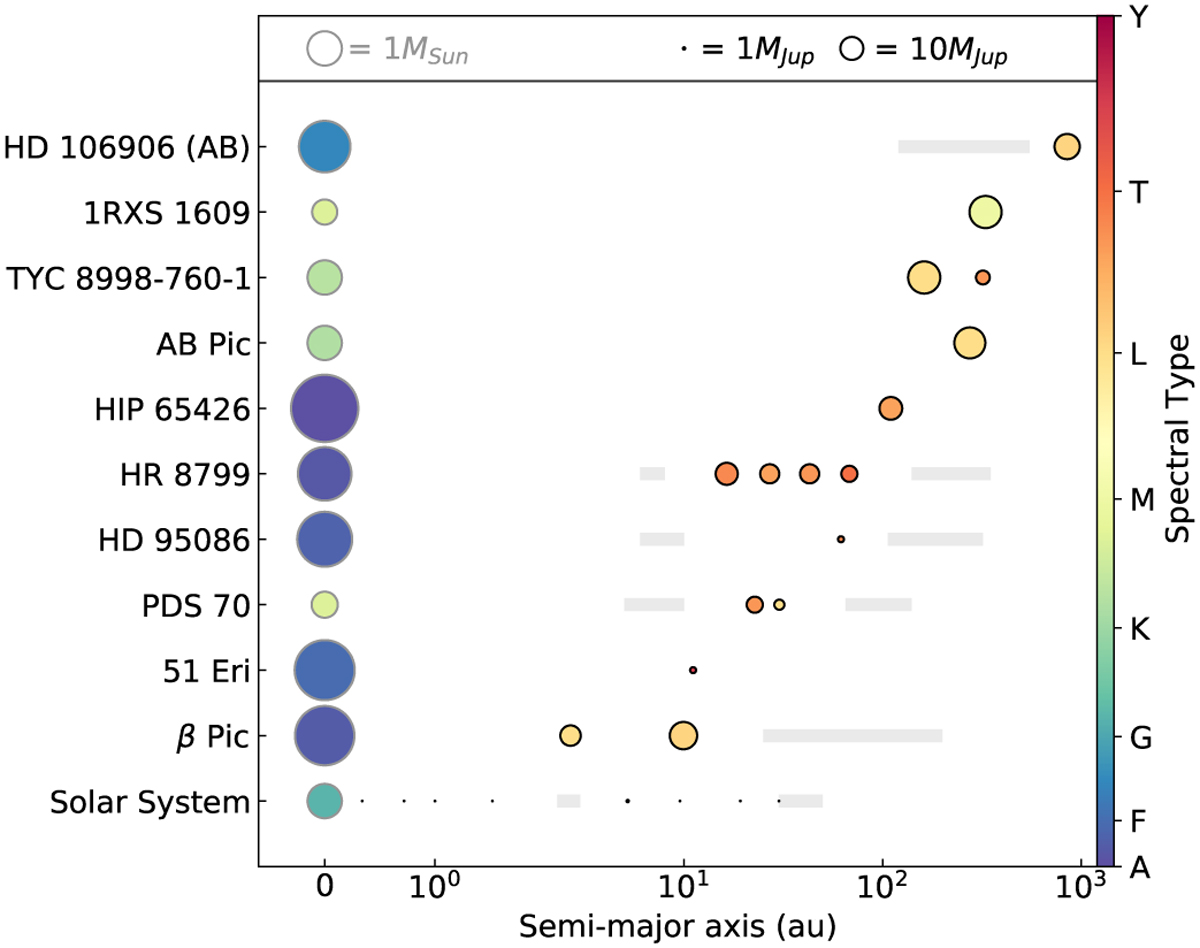
Fig. 1

Download original image
Overview of the architectures of emblematic systems with imaged exoplanets. The sizes of the symbols coincide with masses of the objects. The sizes of the planet markers have been enhanced 70 times with respect to those of the star markers. Colors represent the spectral types, scaled by a power law to visualize details on low-mass objects. The gray area represents the disk or asteroid belt’s location. The Solar System architecture is in the bottom row, where only Jupiter is scaled in mass consistently with the exoplanets.
Current usage metrics show cumulative count of Article Views (full-text article views including HTML views, PDF and ePub downloads, according to the available data) and Abstracts Views on Vision4Press platform.
Data correspond to usage on the plateform after 2015. The current usage metrics is available 48-96 hours after online publication and is updated daily on week days.
Initial download of the metrics may take a while.


