Fig. 8
Download original image
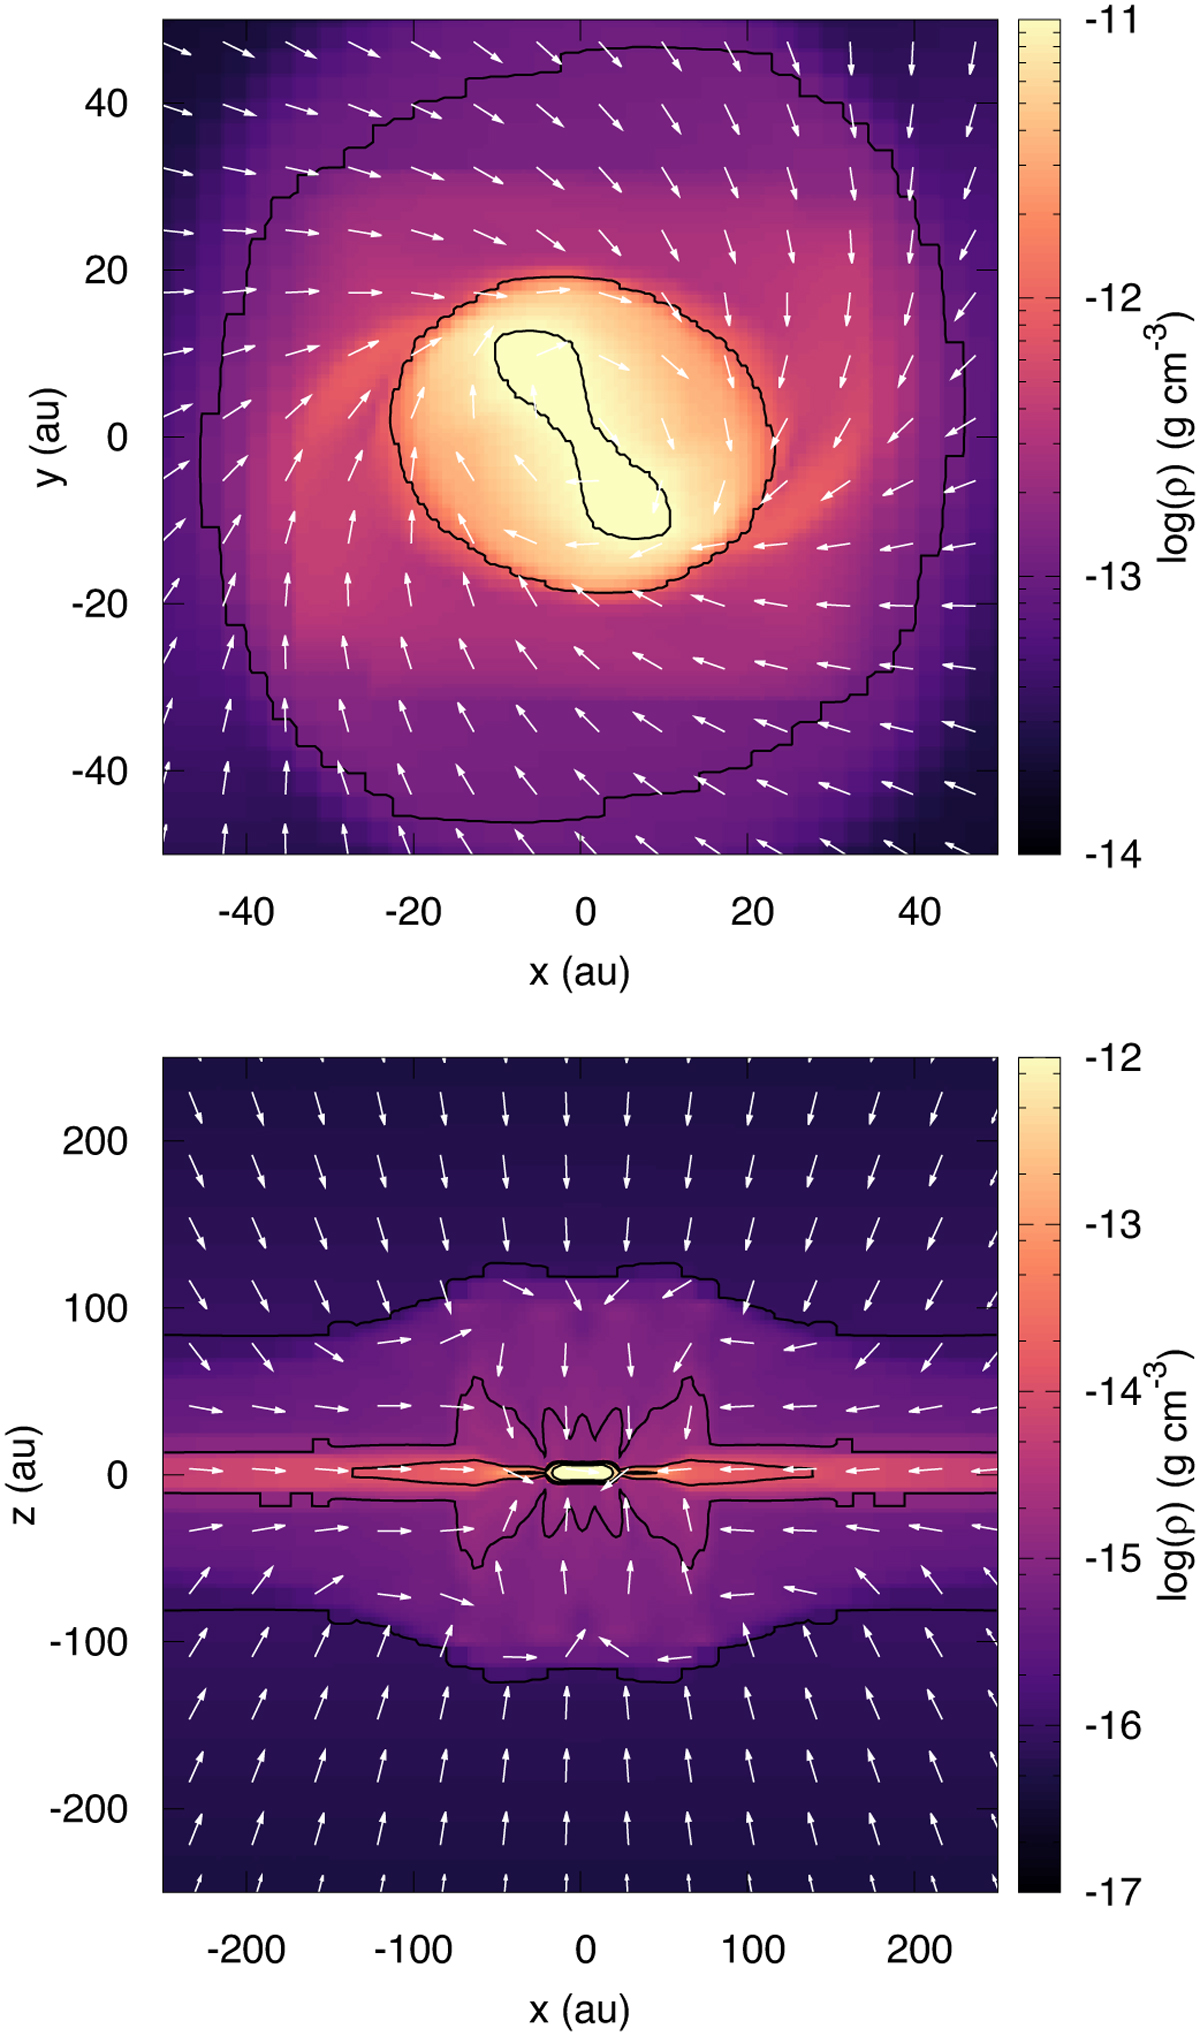
Density slices of the NC-3 simulation, without grain coagulation. Top panel is a face-on slice of the plane z = 0, and the bottom panel an edge-on slice of the plane y = 0. White arrows represent the direction of the gas velocity. The snapshot is taken at the final time-step, 1000 yr after the formation of the first Larson core.
Current usage metrics show cumulative count of Article Views (full-text article views including HTML views, PDF and ePub downloads, according to the available data) and Abstracts Views on Vision4Press platform.
Data correspond to usage on the plateform after 2015. The current usage metrics is available 48-96 hours after online publication and is updated daily on week days.
Initial download of the metrics may take a while.