Fig. 7
Download original image
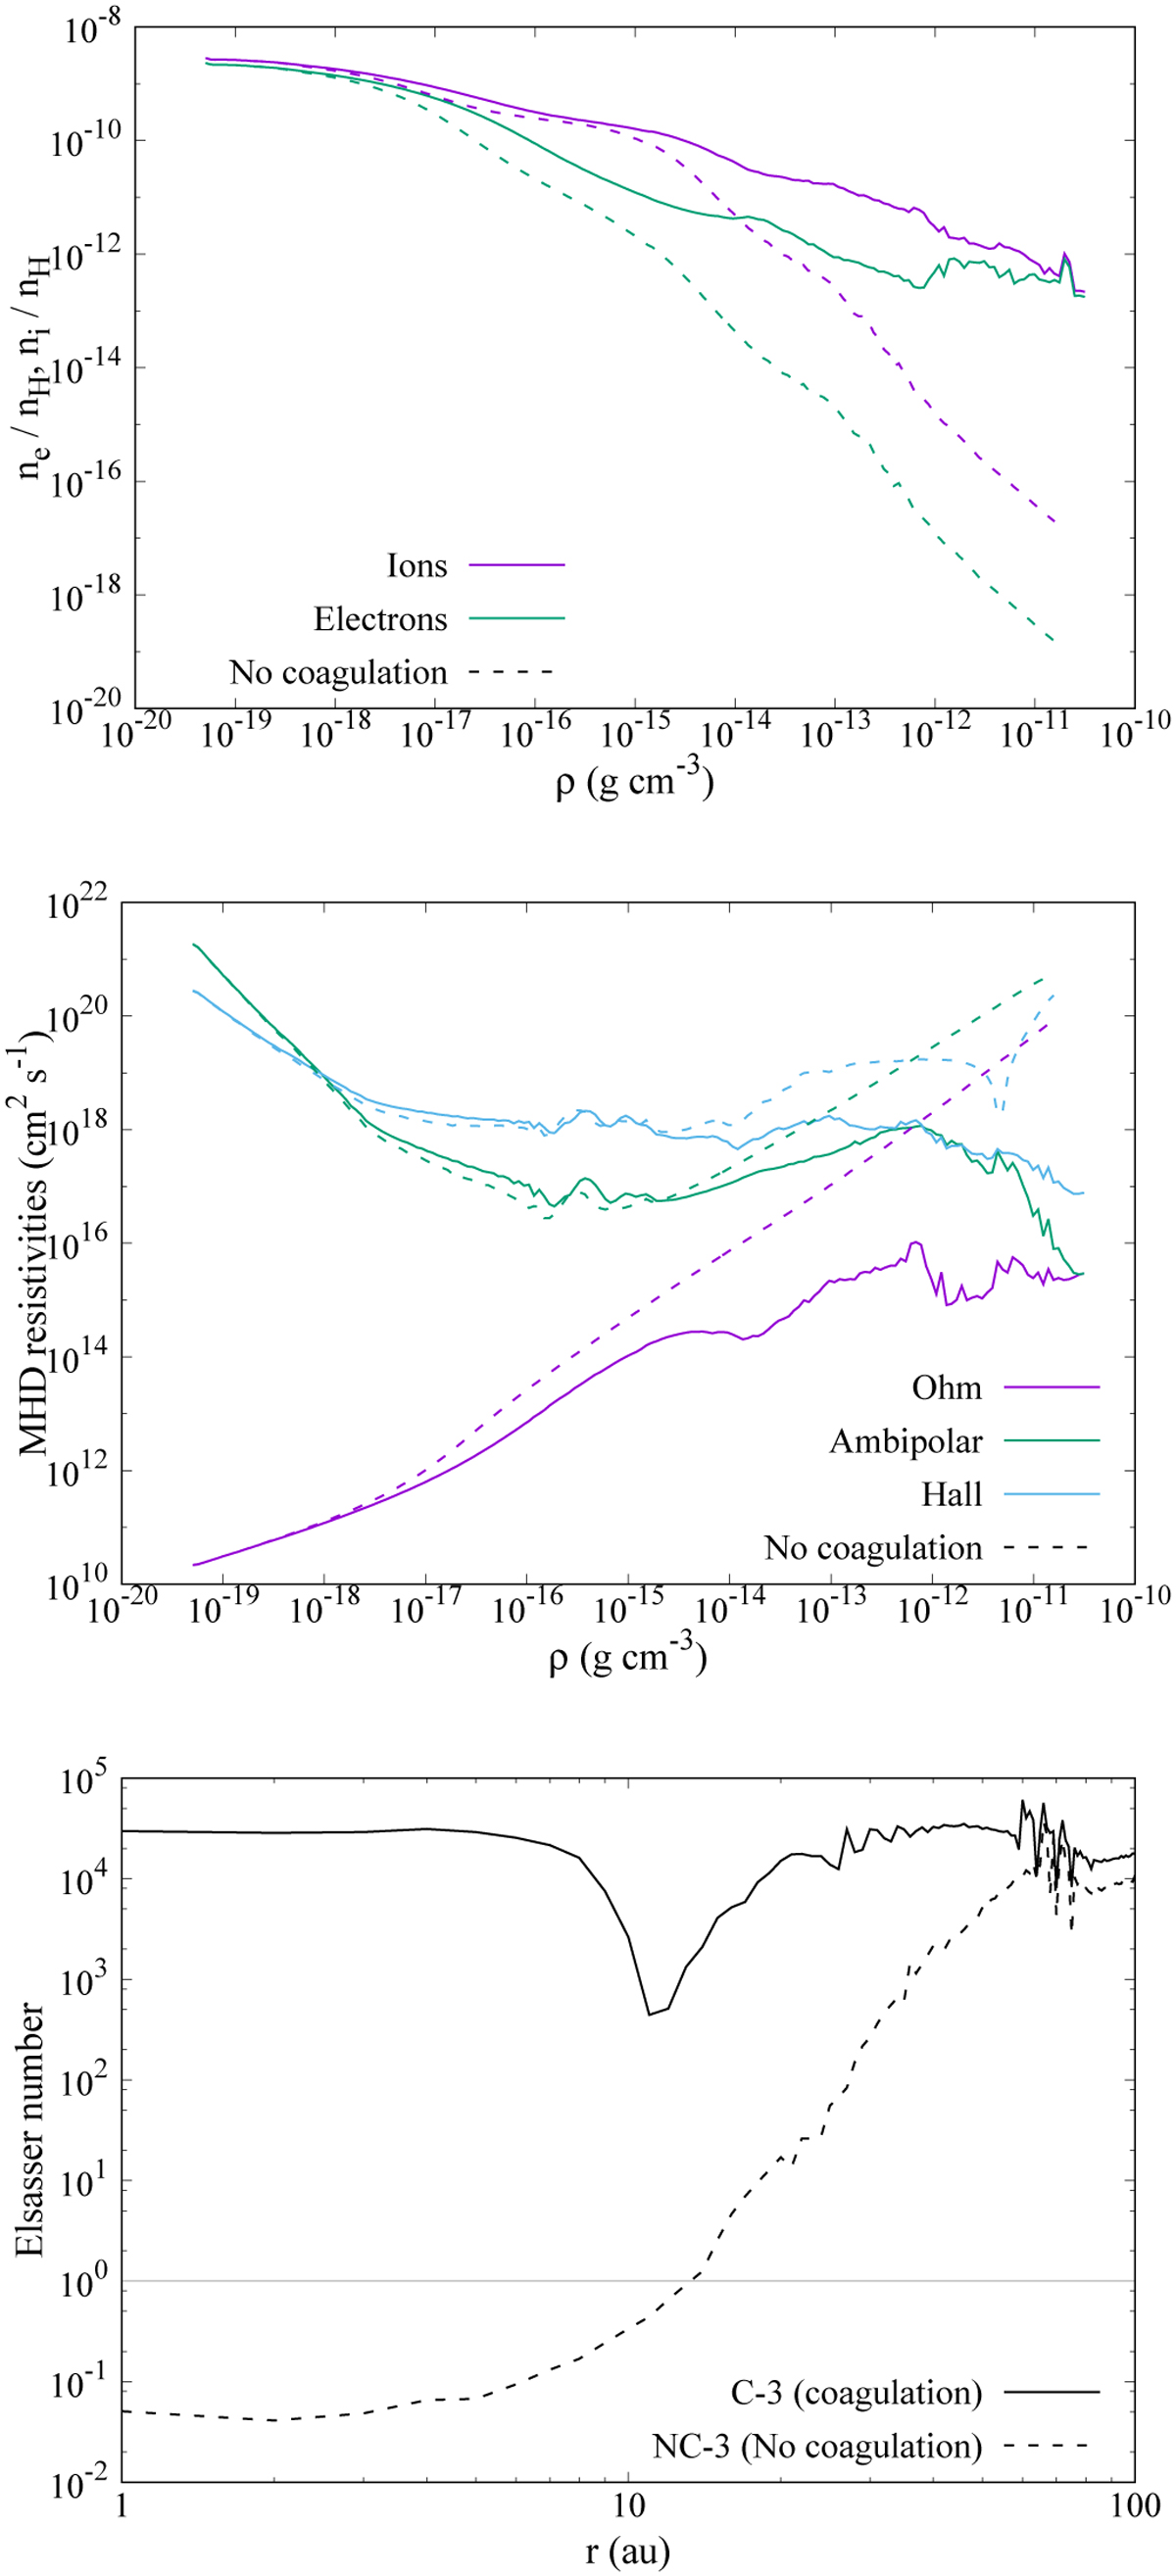
Non-ideal MHD effects in the C-3 and NC-3 simulations. Top panel: abundances of ions (purple) and electrons (green) as a function of density in models with coagulation (C-3; solid lines) or without it (NC-3; dashed lines). Middle panel: volume-averaged Ohmic (purple), ambipolar (green), and Hall (blue) resistivities for the same models. Bottom panel: average ambipolar Elsasser number Am in the mid-plane as a function of radius. The thin grey line represents Am = 1.
Current usage metrics show cumulative count of Article Views (full-text article views including HTML views, PDF and ePub downloads, according to the available data) and Abstracts Views on Vision4Press platform.
Data correspond to usage on the plateform after 2015. The current usage metrics is available 48-96 hours after online publication and is updated daily on week days.
Initial download of the metrics may take a while.