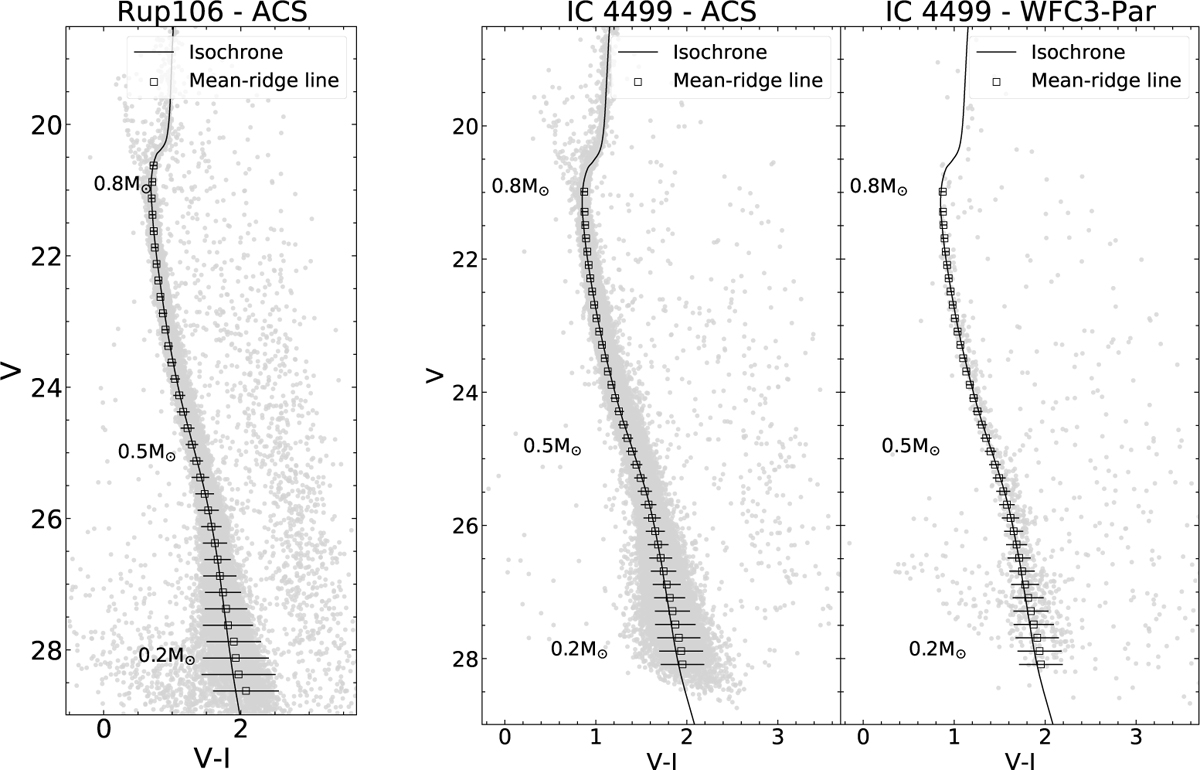
Fig. 9.
Download original image
CMD of the HST data for Rup 106 and IC 4499 (left and right bi-panels, respectively). The ACS data used to sample the core region are complemented with a catalogue obtained with ACS and WFC3 parallel observations for Rup 106 and IC 4499, respectively. The open squares indicate the mean ridge lines of the clusters, while the solid curve shows the best-fit isochrones.
Current usage metrics show cumulative count of Article Views (full-text article views including HTML views, PDF and ePub downloads, according to the available data) and Abstracts Views on Vision4Press platform.
Data correspond to usage on the plateform after 2015. The current usage metrics is available 48-96 hours after online publication and is updated daily on week days.
Initial download of the metrics may take a while.