Open Access
Fig. 3.
Download original image
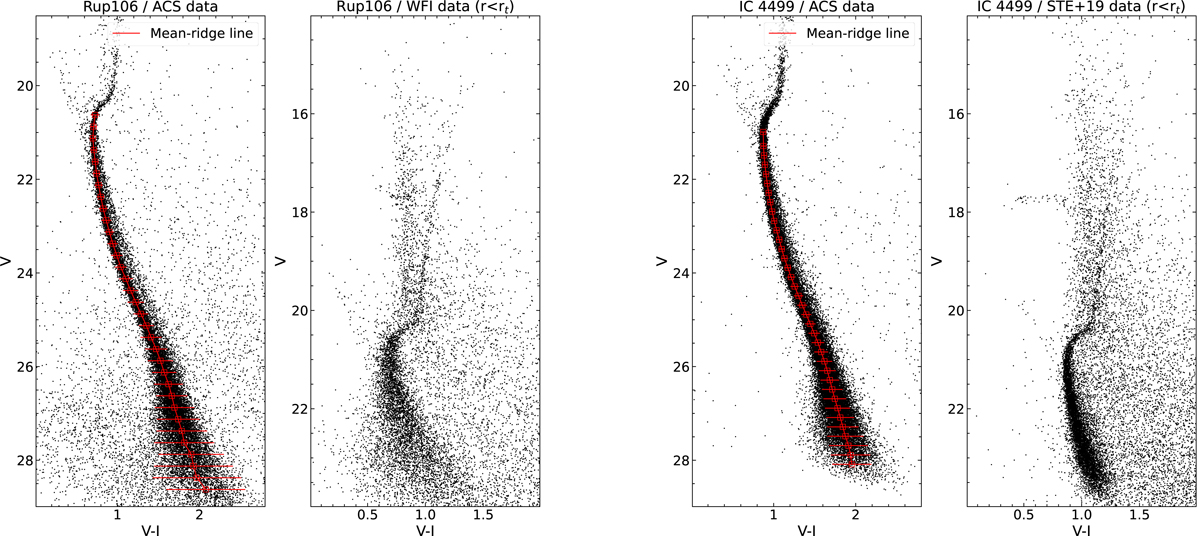
Colour–magnitude diagrams for Rup 106 (two plots on the left-hand side) and IC 4499 (two plots on the right-hand side). The MS mean-ridge calculated on the HST data is shown as a red solid vertical line for both clusters.
Current usage metrics show cumulative count of Article Views (full-text article views including HTML views, PDF and ePub downloads, according to the available data) and Abstracts Views on Vision4Press platform.
Data correspond to usage on the plateform after 2015. The current usage metrics is available 48-96 hours after online publication and is updated daily on week days.
Initial download of the metrics may take a while.