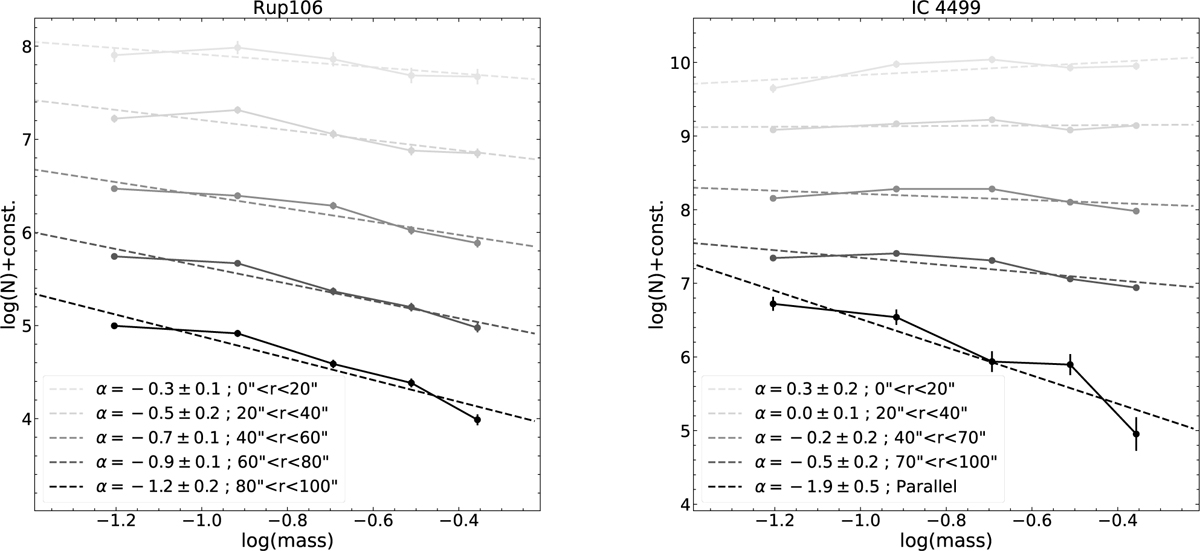
Fig. 10.
Download original image
Cluster completeness-corrected MFs calculated at different radial annuli from the cluster centres. The dashed line indicates the fit to the MF. The slopes of the fits indicate the slope of the MF and are also indicated in the plots. We reiterate here that in our notation, the Salpeter IMF would have a slope α = −2.35, and that a positive index implies that the number of stars decreases with decreasing mass.
Current usage metrics show cumulative count of Article Views (full-text article views including HTML views, PDF and ePub downloads, according to the available data) and Abstracts Views on Vision4Press platform.
Data correspond to usage on the plateform after 2015. The current usage metrics is available 48-96 hours after online publication and is updated daily on week days.
Initial download of the metrics may take a while.