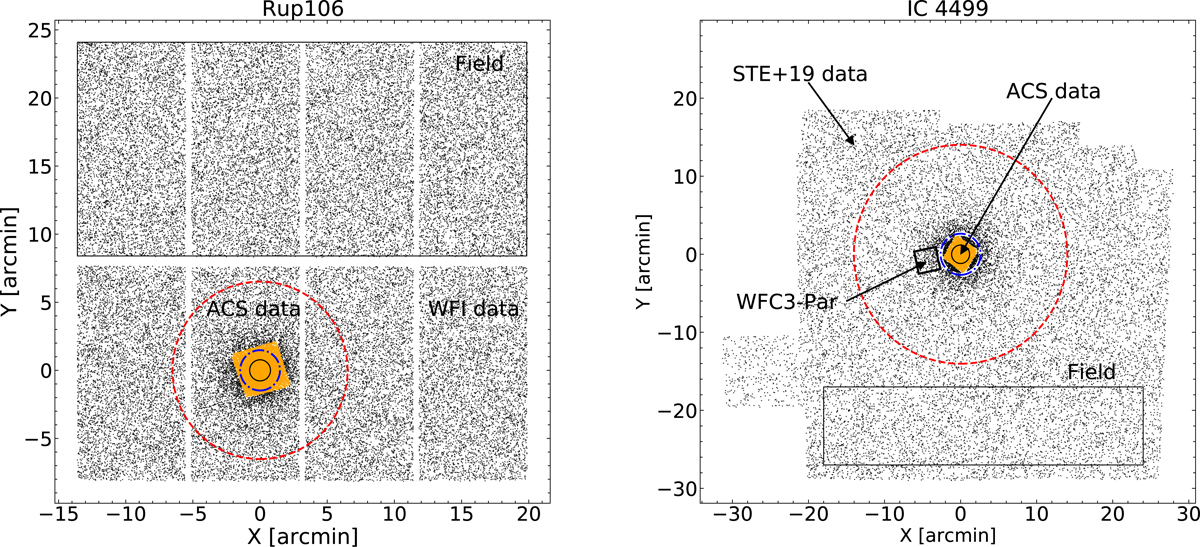
Fig. 1.
Download original image
Data FoV. Composite FOVs showing the stars sampled in Rup 106 (left panel) and IC 4499 (right panel). The central field identifies the stars sampled with the ACS catalogues (orange points). The solid (black), dot-dashed (blue), and dashed (red) circles mark the core, half-mass, and tidal radii of the clusters, respectively. The area used to estimate the field contamination and the area covered by the WFC3 parallel observations are also labelled.
Current usage metrics show cumulative count of Article Views (full-text article views including HTML views, PDF and ePub downloads, according to the available data) and Abstracts Views on Vision4Press platform.
Data correspond to usage on the plateform after 2015. The current usage metrics is available 48-96 hours after online publication and is updated daily on week days.
Initial download of the metrics may take a while.