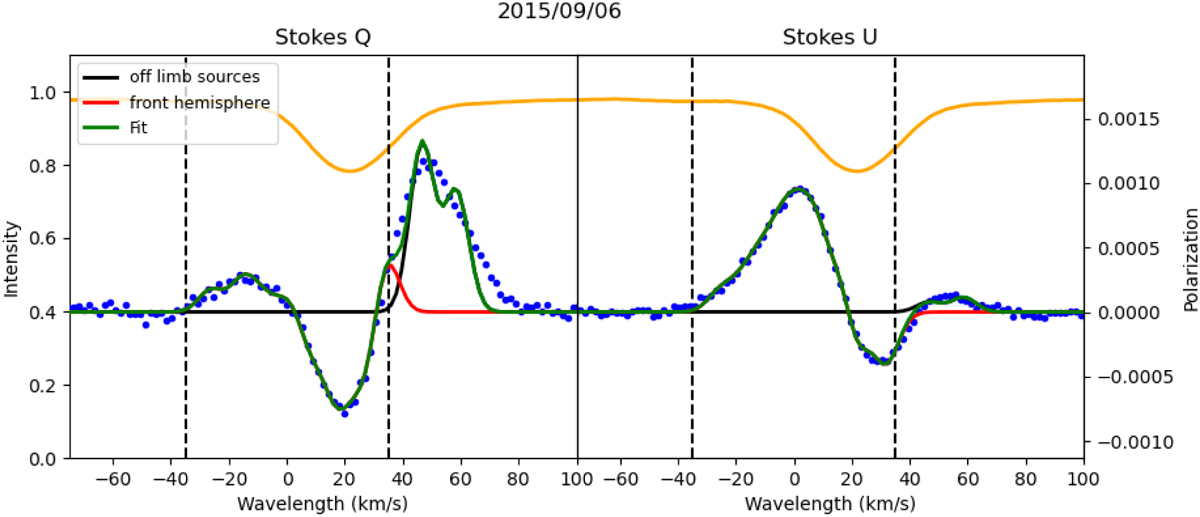
Fig. 2
Download original image
Observed linear polarization of μ Cep on September 6, 2015. The observed Stokes Q is plotted on the left, and Stokes U on the right, as dots in both cases. Continuous lines represent the best fit from the assumed model (green line) with separated contributions from the front disk brightness distribution (red) and the two plumes beyond the limb (black), visible at those wavelengths when they do not constitute the whole contribution to the final fit in green. The upper (orange) profile shows the normalized intensity profile. The vertical dashed lines give the two limiting velocities, Vp and V*.
Current usage metrics show cumulative count of Article Views (full-text article views including HTML views, PDF and ePub downloads, according to the available data) and Abstracts Views on Vision4Press platform.
Data correspond to usage on the plateform after 2015. The current usage metrics is available 48-96 hours after online publication and is updated daily on week days.
Initial download of the metrics may take a while.