Fig. 1
Download original image
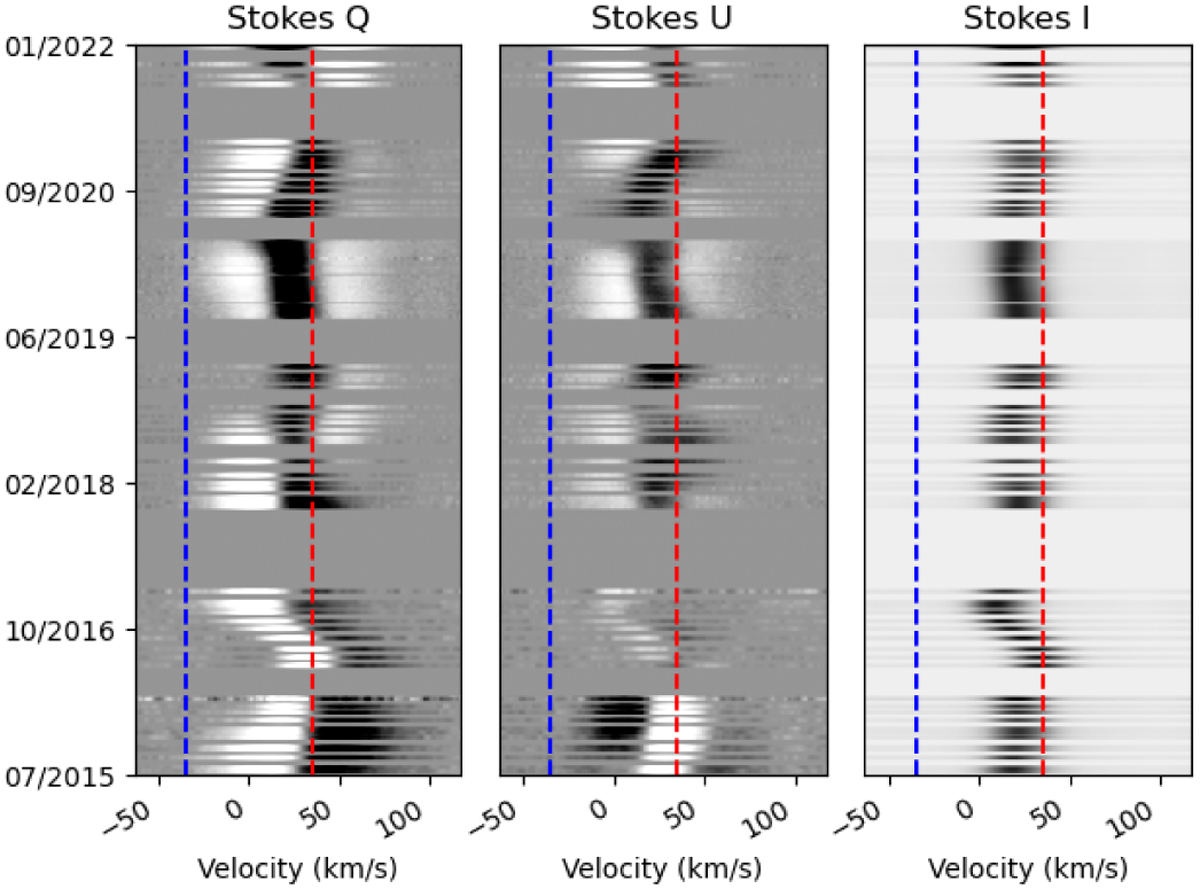
Pile-up of the Stokes Q (left), U (center) and I (right) profiles over the whole time series. For illustrative purposes, every observation has been made to span 15 days on the vertical direction. The blue and red vertical lines mark the maximum plasma velocity Vp and the radial velocity of the center of mass of the star V* respectively (see main text for definitions). Velocities are measured in the heliocentric reference system.
Current usage metrics show cumulative count of Article Views (full-text article views including HTML views, PDF and ePub downloads, according to the available data) and Abstracts Views on Vision4Press platform.
Data correspond to usage on the plateform after 2015. The current usage metrics is available 48-96 hours after online publication and is updated daily on week days.
Initial download of the metrics may take a while.