Fig. B.1
Download original image
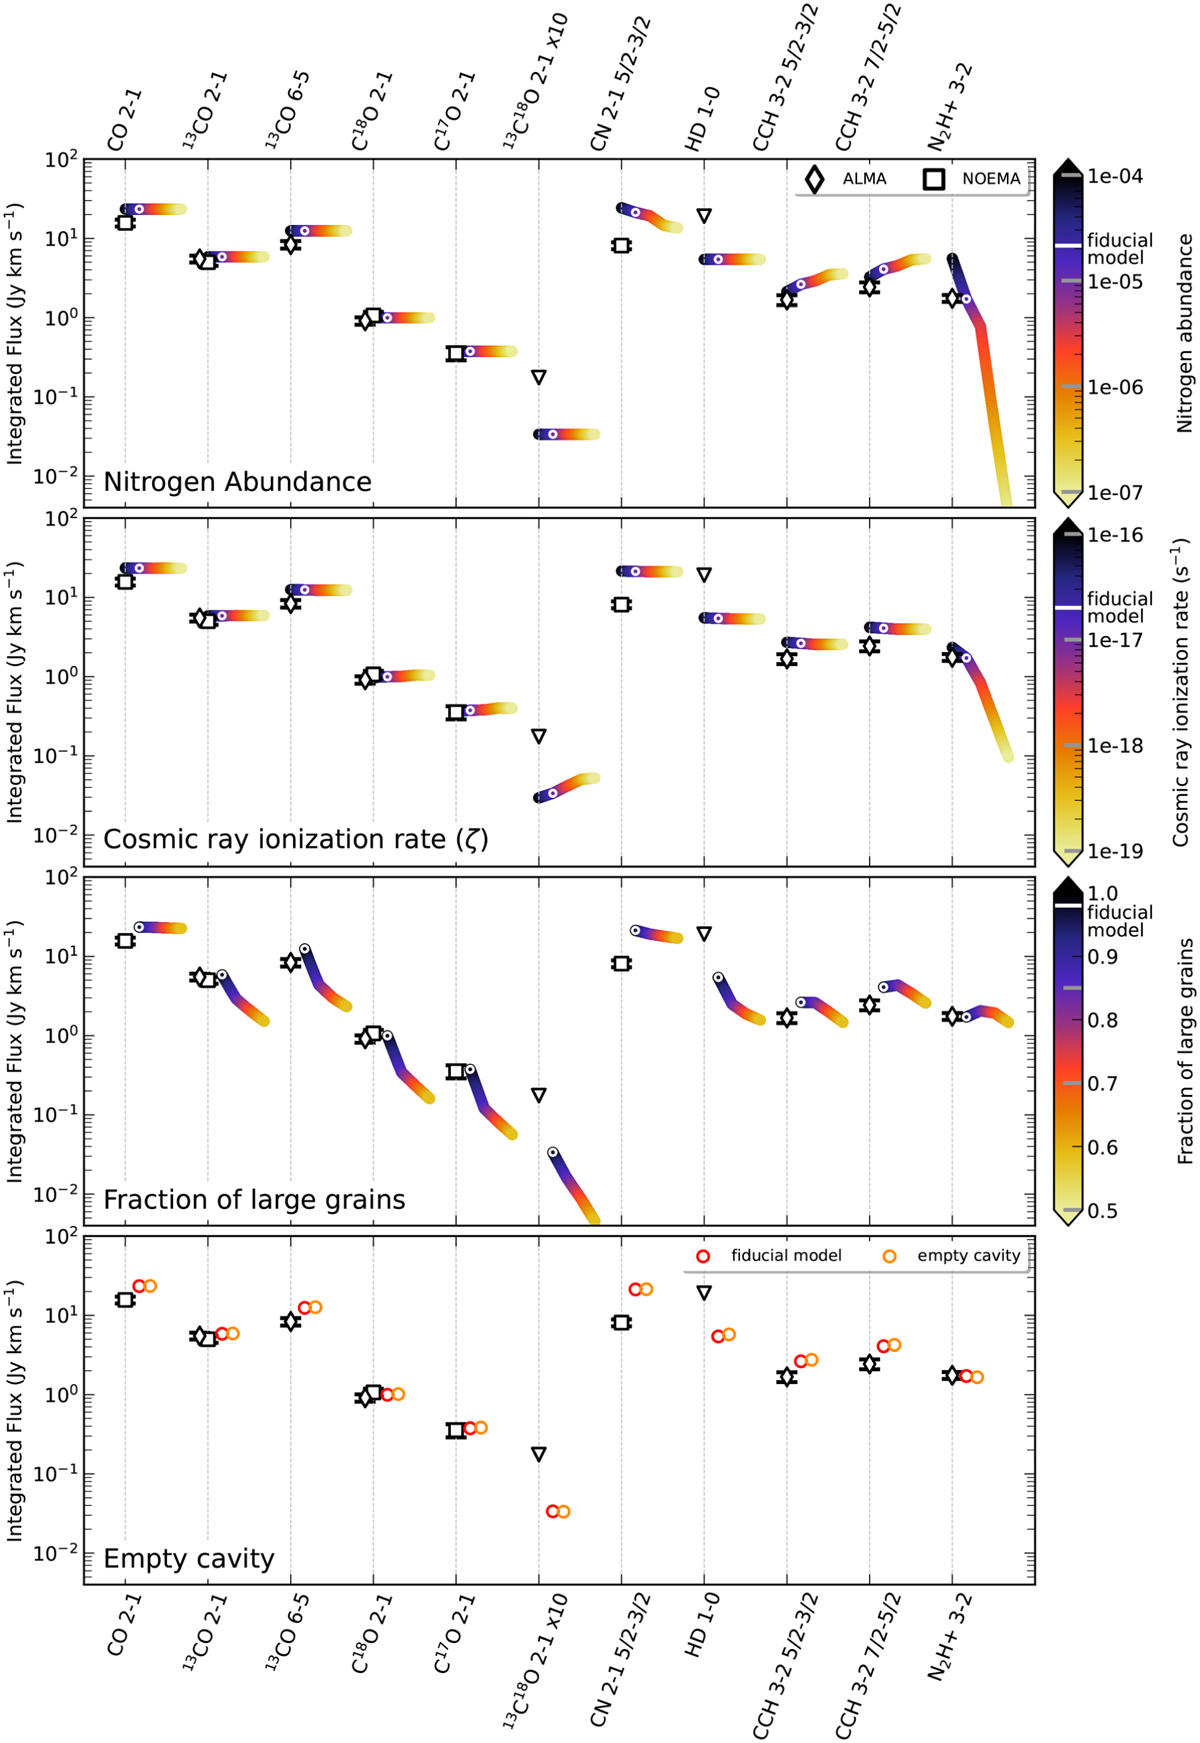
Total flux dependencies of the various molecules on the main parameters in the model. From top to bottom: Nitrogen abundance, cosmic ray ionization rate ζ, fraction of settled large grains fℓ. Data grid points and the fiducial model are shown in the colorbar as grey and white tickmarks, respectively. The color bars represent interpolated values between these models. The fiducial model is shown in the plots as a white dot. The bottom panel shows the result for a similar model as the fiducial model, but with a cleared cavity between 1-63 AU (see Fig. 3). Note that the fiducial model is the same as the “best” model in Fig. 2.
Current usage metrics show cumulative count of Article Views (full-text article views including HTML views, PDF and ePub downloads, according to the available data) and Abstracts Views on Vision4Press platform.
Data correspond to usage on the plateform after 2015. The current usage metrics is available 48-96 hours after online publication and is updated daily on week days.
Initial download of the metrics may take a while.