Fig. 5
Download original image
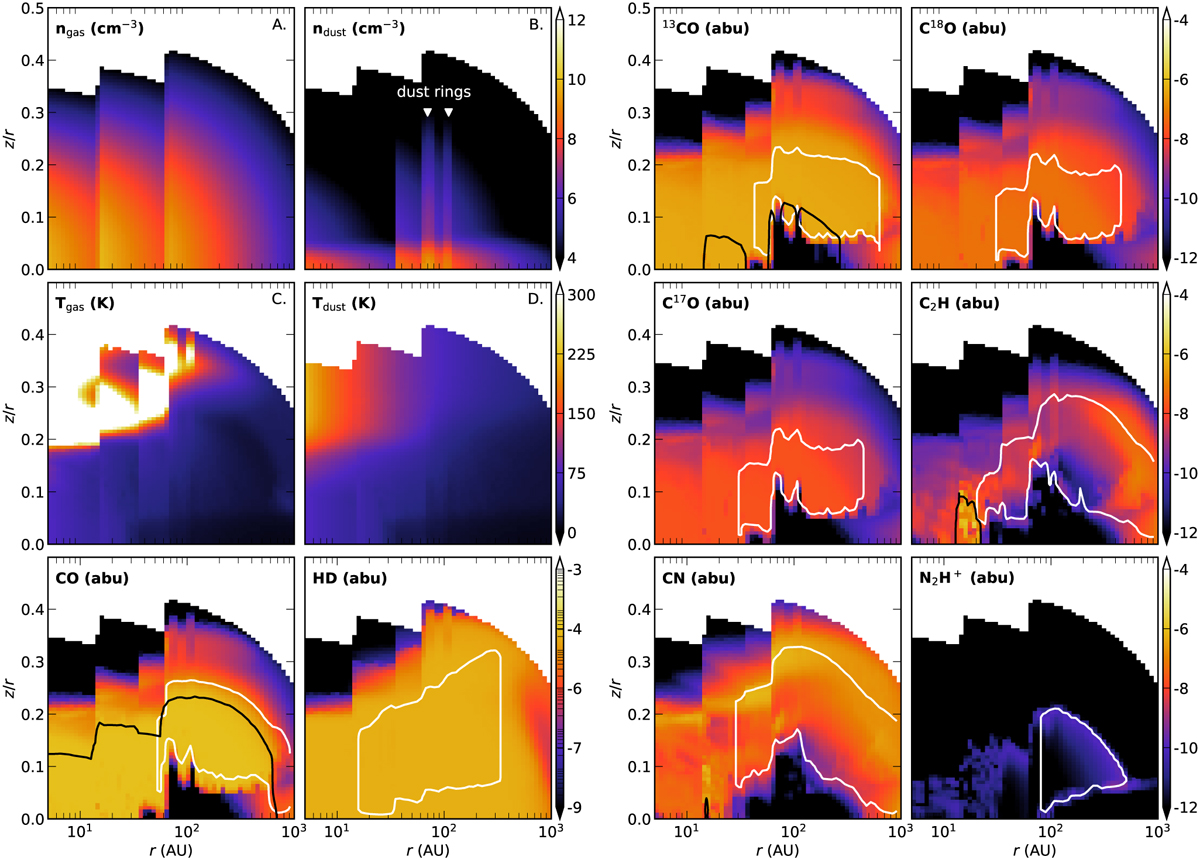
Overview of the DALI model output. The four panels left top (A−D) present the gas and dust density structure and the gas and dust temperature, respectively. The other panels present the molecular abundances of the molecular transitions in the most representative DALI model, assuming a gas-to-dust ratio of 25 and a carbon depletion factor of 4. The white contours represent the region where 95% of the emission originates, the black lines show the τ = 1 surface for the optically thick emission lines.
Current usage metrics show cumulative count of Article Views (full-text article views including HTML views, PDF and ePub downloads, according to the available data) and Abstracts Views on Vision4Press platform.
Data correspond to usage on the plateform after 2015. The current usage metrics is available 48-96 hours after online publication and is updated daily on week days.
Initial download of the metrics may take a while.