Fig. 3
Download original image
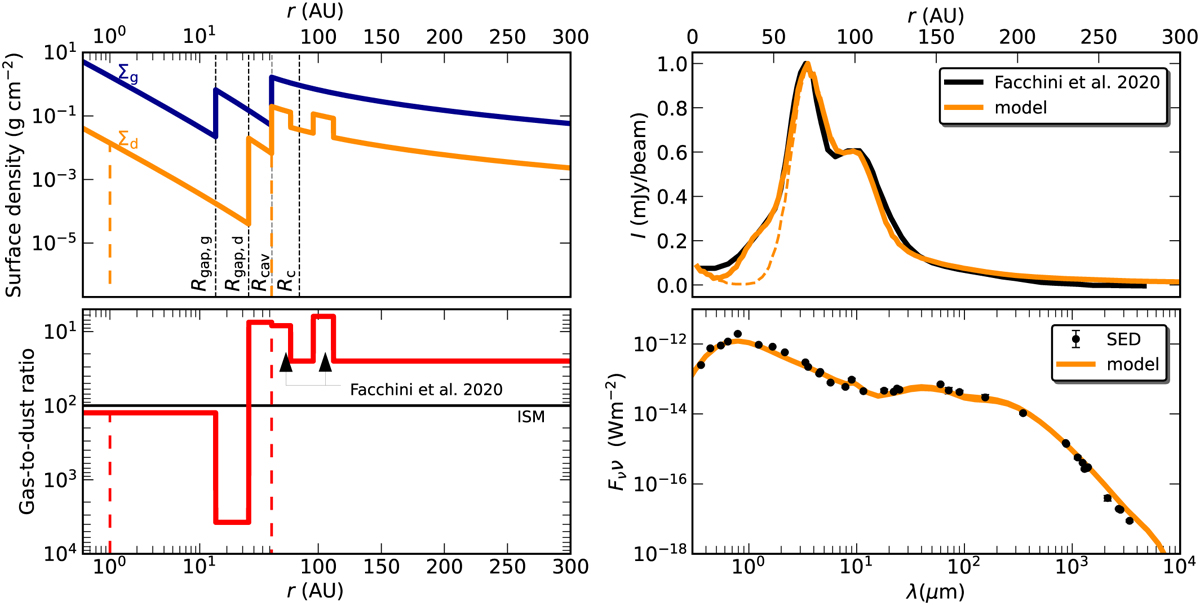
Setup of the DALI model for LkCa 15, top-left: normalized surface density of the dust (orange) and gas (blue) as function of radius, bottom-left: gas-to-dust ratio as function of radius in the fiducial model, this is a direct consequence of the used gas and dust surface density profiles shown in the top left panel, top-right: radial profile of the continuum observations (black) and the model (orange) normalized to 1, bottom-right: observed SED in black with the modeled continuum fluxes in orange. Dashed lines show the setup for the same model with cleared cavity, discussed in Appendix B.
Current usage metrics show cumulative count of Article Views (full-text article views including HTML views, PDF and ePub downloads, according to the available data) and Abstracts Views on Vision4Press platform.
Data correspond to usage on the plateform after 2015. The current usage metrics is available 48-96 hours after online publication and is updated daily on week days.
Initial download of the metrics may take a while.