Fig. 2
Download original image
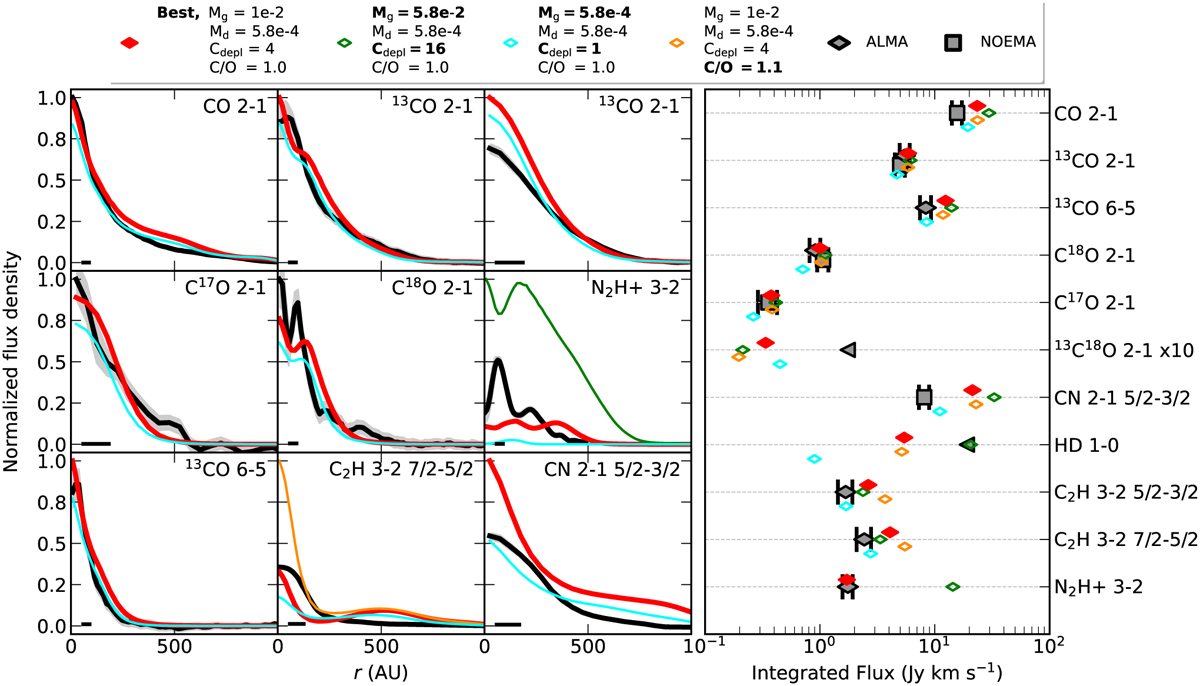
Azimuthally averaged radial proflies of the different gas tracers used in this work (left). Data are shown as black lines with shaded 1 σ uncertainty and normalized to the brightest point for visualization purposes. The full width at half maximum of the beams is shown as a black horizontal line in the lower left-hand corner. The best-fitting model with a gas mass of 0.012 M⊙ and a factor of 4 in carbon depletion is overplotted in red. The blue line shows the same model but with a lower gas-to-dust ratio, resulting in a gas mass of 4 × 10⁻⁴ M⊙, and no carbon depletion. This model reproduces the optically thick CN and CO lines somewhat better, but underproduces the optically thin N2H+ line. The orange line illustrates the C2H radial profile for an increased C/O ratio of 1.1. With C/O > 1 excess carbon, not in CO, changes the carbon chemistry completely. Integrated line flux of the various emission lines analyzed in this paper (right). Black squares represent the observed line fluxes of NOEMA data, black diamonds represent the observed line fluxes of ALMA data, black triangles denote upper limits, taken at 3σ. Colored diamonds show the results for the same models as in the left panel.
Current usage metrics show cumulative count of Article Views (full-text article views including HTML views, PDF and ePub downloads, according to the available data) and Abstracts Views on Vision4Press platform.
Data correspond to usage on the plateform after 2015. The current usage metrics is available 48-96 hours after online publication and is updated daily on week days.
Initial download of the metrics may take a while.