Fig. 1
Download original image
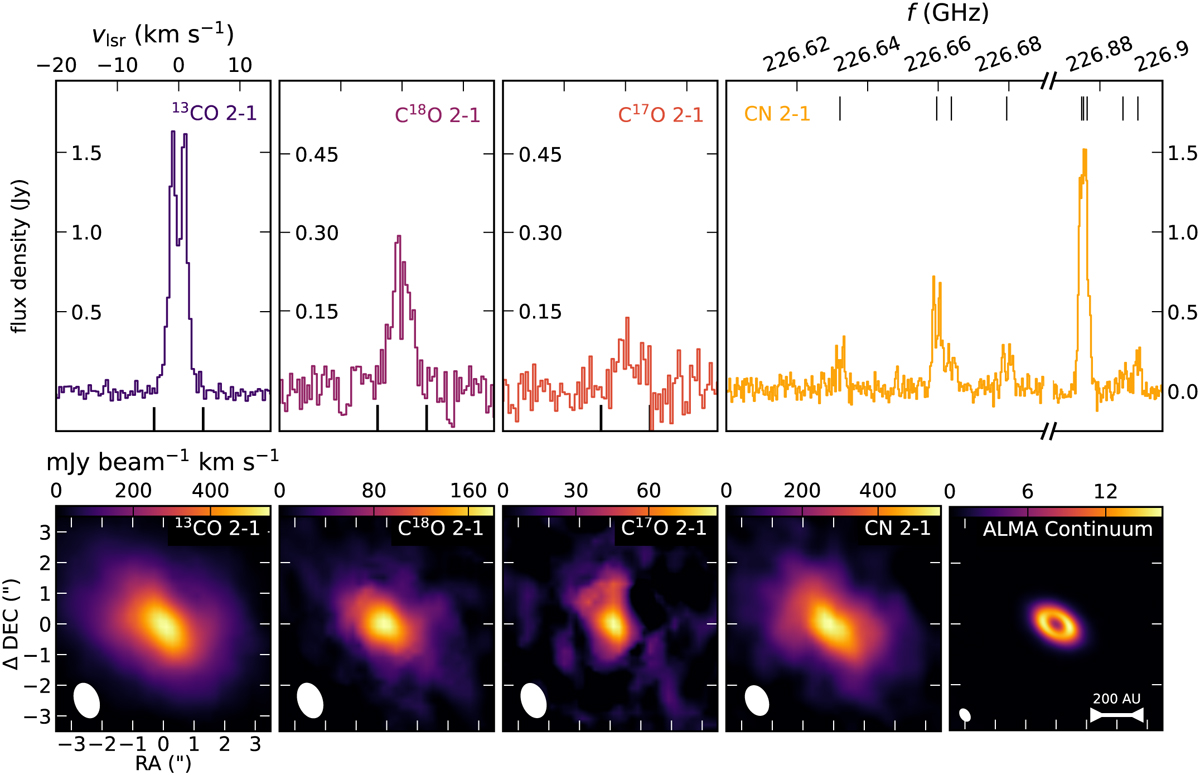
Disk-integrated spectra (top) and total intensity or moment 0 maps of the new emission lines (bottom) obtained with NOEMA at 1.1″ × 0.7″. ALMA band 6 continuum data at 0.3″ × 0.3″ are shown for comparison. Integration limits for the moment 0 maps are indicated with black tickmarks in the bottom at −4 and +4 km s−1. Robustly detected CN hyper-fine structure lines are indicated in the top right panel with black tick marks. For each moment 0 map, the beam is shown as a white ellipse in the lower left corner.
Current usage metrics show cumulative count of Article Views (full-text article views including HTML views, PDF and ePub downloads, according to the available data) and Abstracts Views on Vision4Press platform.
Data correspond to usage on the plateform after 2015. The current usage metrics is available 48-96 hours after online publication and is updated daily on week days.
Initial download of the metrics may take a while.