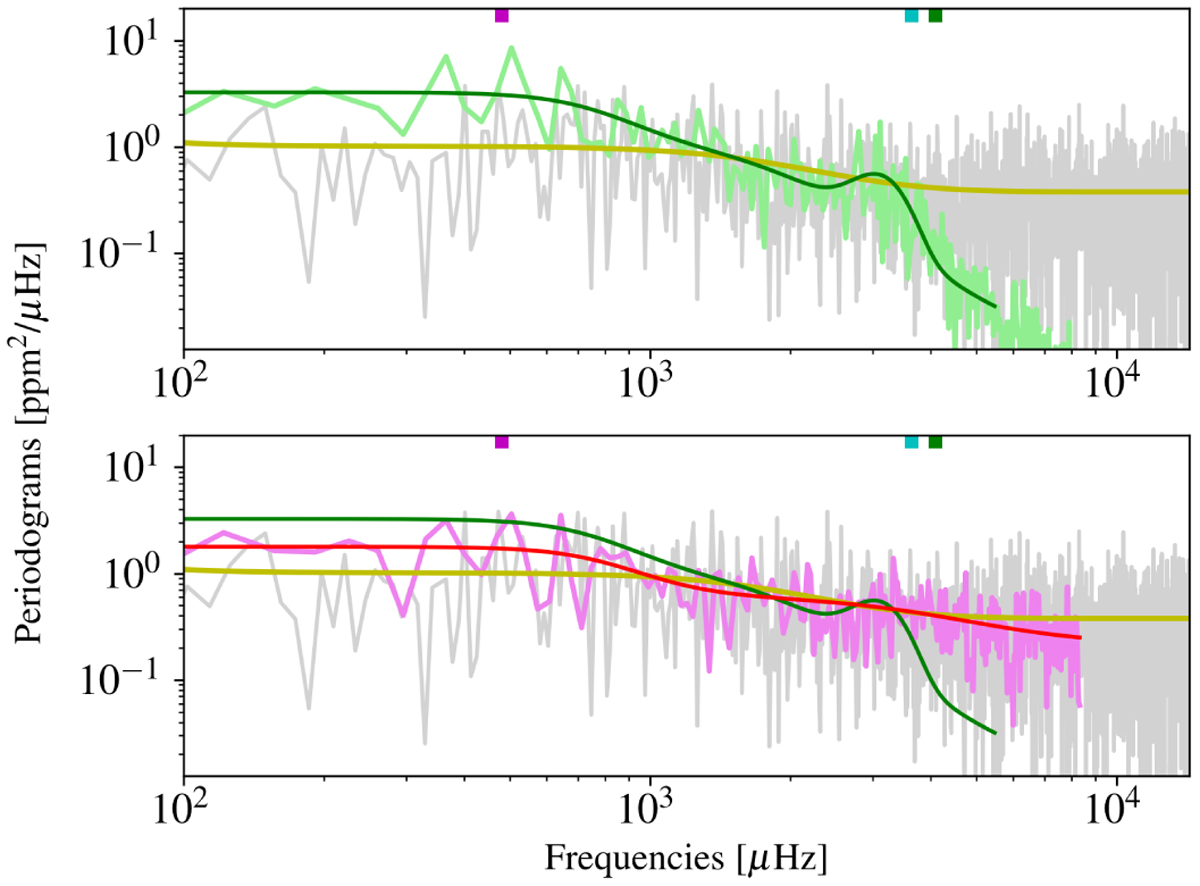
Fig. 8
Download original image
Impact of the WGN on the periodograms. Top: comparison of the periodogram of HD 67458 (gray) and the averaged periodograms of three solar 8-h subseries (green). Best-fitting models resulting from Harvey-functions (Eq. (1)) fits on these CHEOPS and VIRGO periodograms are shown in yellow and green, respectively. Bottom: same comparison but with the averaged periodogram of three solar subseries with the WGN added (pink). The associated best-fitting Harvey function is shown in red. We see how the WGN impacts the periodogram shape (and so the extraction of the granulation properties) by comparing the green and red solid lines. In both panels, the different cut-off frequencies νcut, fH, and fg inferred on CHEOPS observations are represented by the green, cyan and magenta vertical lines, respectively.
Current usage metrics show cumulative count of Article Views (full-text article views including HTML views, PDF and ePub downloads, according to the available data) and Abstracts Views on Vision4Press platform.
Data correspond to usage on the plateform after 2015. The current usage metrics is available 48-96 hours after online publication and is updated daily on week days.
Initial download of the metrics may take a while.