Fig. 7
Download original image
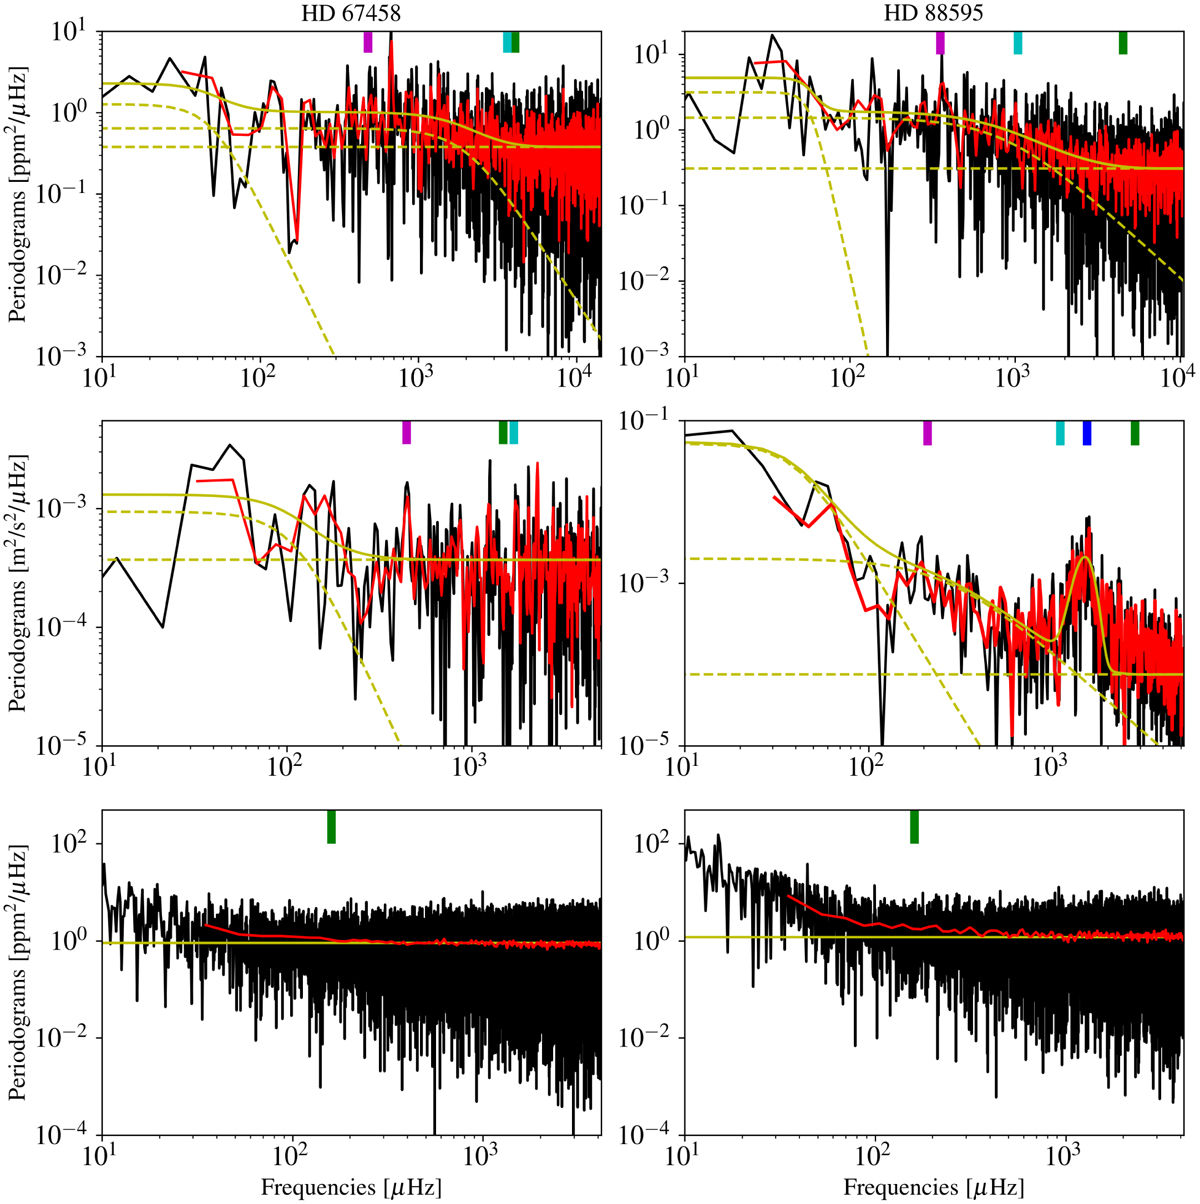
Periodograms of HD 67458 (left) and HD 88595 (right). From top to bottom: Lomb-Scargle periodograms of CHEOPS, ESPRESSO and TESS observations computed on the whole dataset are shown in black. Their respective averaged periodograms, resulting from the average of the periodograms of each CHEOPS visits, ESPRESSO nights, or TESS 8-h subseries, are shown in red. Yellow lines represent the best-fitting Harvey models, given in Eq. (1), that fits the Lomb-Scargle periodograms of each datasets. The different components of this model (white noise, oscillation modes, granulation, supergranulation) are represented in dotted yellow. When relevant, the different cut-off frequencies are represented by vertical lines: νcut in green (used to infer the level of white noise), νmax in blue (frequency only relevant for ESPRESSO data of HD 88595), fH in cyan (frequency generally close to νcut), and fg in magenta.
Current usage metrics show cumulative count of Article Views (full-text article views including HTML views, PDF and ePub downloads, according to the available data) and Abstracts Views on Vision4Press platform.
Data correspond to usage on the plateform after 2015. The current usage metrics is available 48-96 hours after online publication and is updated daily on week days.
Initial download of the metrics may take a while.