Fig. 6
Download original image
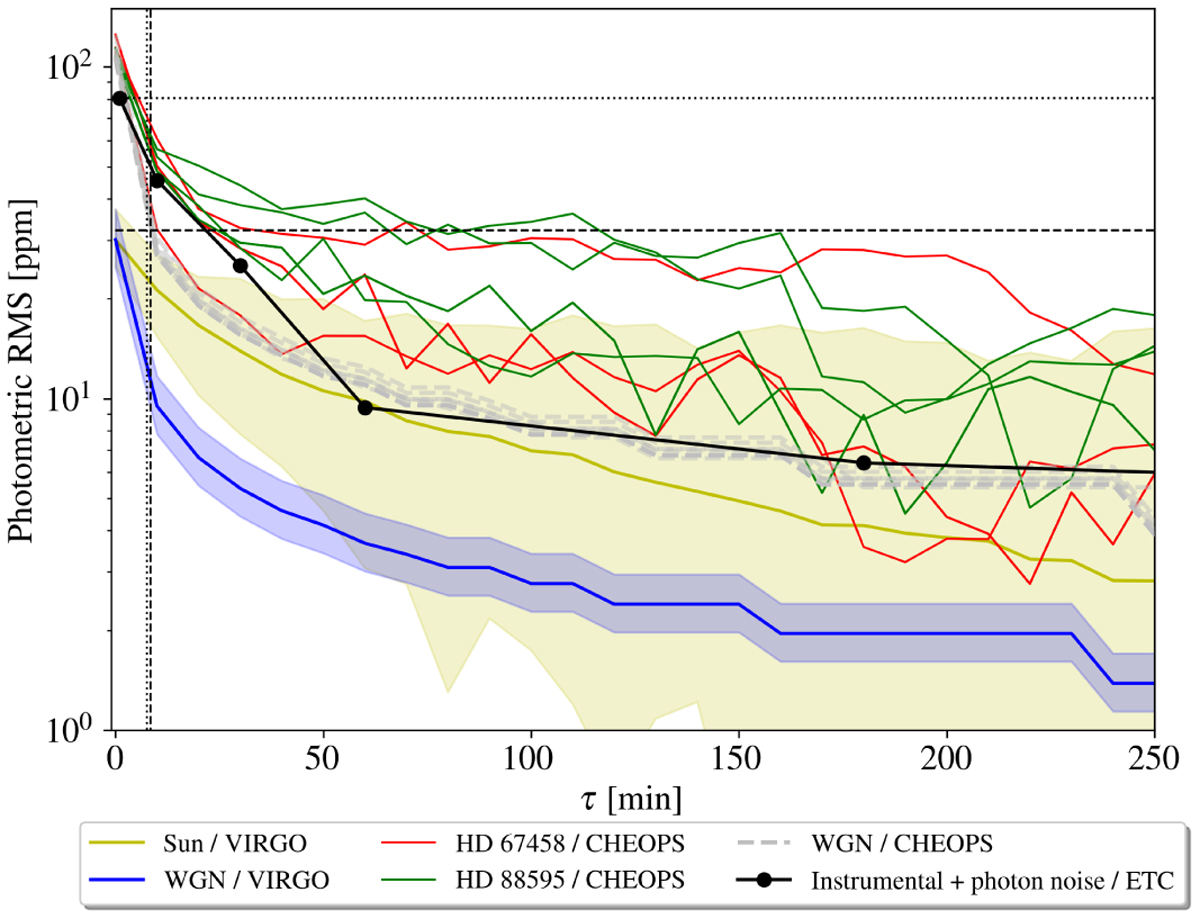
Effect of temporal binning on the RMS of the photometric data of HD 67458 (three red solid lines for the three CHEOPS visits) and HD 88595 (four green solid lines for the four CHEOPS visits). The behavior of WGNs of the same variance than each CHEOPS visit are shown with the dashed gray lines. RMS values obtained on the 265 solar VIRGO subseries are shown with the yellow beam (median value in solid), and the corresponding behavior of WGNs in blue (median value in solid). Prediction from the CHEOPS ETC are shown with the black thin lines with dots. The transit depth of an Earth-size planet orbiting in the HZ of each star are shown by the dashed horizontal lines. Their typical transit ingress duration are shown by the vertical dotted and dashed lines.
Current usage metrics show cumulative count of Article Views (full-text article views including HTML views, PDF and ePub downloads, according to the available data) and Abstracts Views on Vision4Press platform.
Data correspond to usage on the plateform after 2015. The current usage metrics is available 48-96 hours after online publication and is updated daily on week days.
Initial download of the metrics may take a while.