Fig. 5
Download original image
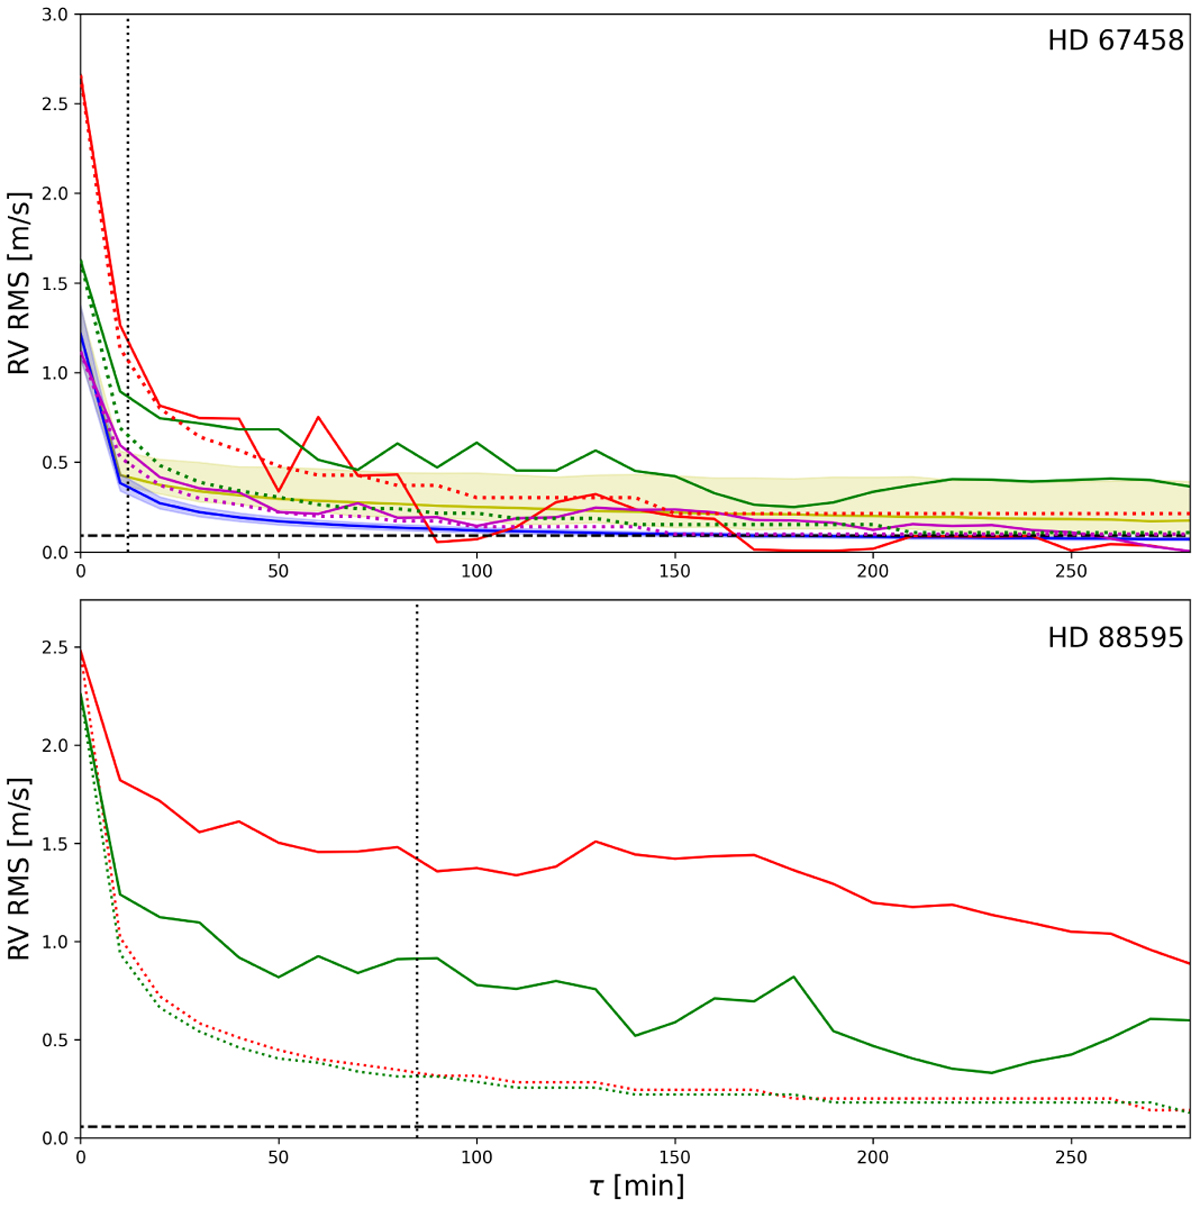
Effect of temporal binning on the RV RMS of HD 67458 (top) and HD 88595 (bottom). Each color (red, green and magenta) represents one night of ESPRESSO observations. The behavior of WGNs having the same variance as the considered dataset is shown by the colored dotted lines. RMS values obtained on the 75 solar GOLF subseries are shown in yellow in the top panel, and the corresponding WGNs in blue (median values are shown by the yellow and blue solid lines). The RV semi-amplitude of an Earth-like planet orbiting in the HZ of each star are shown by the dashed horizontal lines. The exposure times needed to mitigate the p-modes oscillations down to the ~10 cm s−1 level are shown by the dotted vertical lines.
Current usage metrics show cumulative count of Article Views (full-text article views including HTML views, PDF and ePub downloads, according to the available data) and Abstracts Views on Vision4Press platform.
Data correspond to usage on the plateform after 2015. The current usage metrics is available 48-96 hours after online publication and is updated daily on week days.
Initial download of the metrics may take a while.