Fig. E.1
Download original image
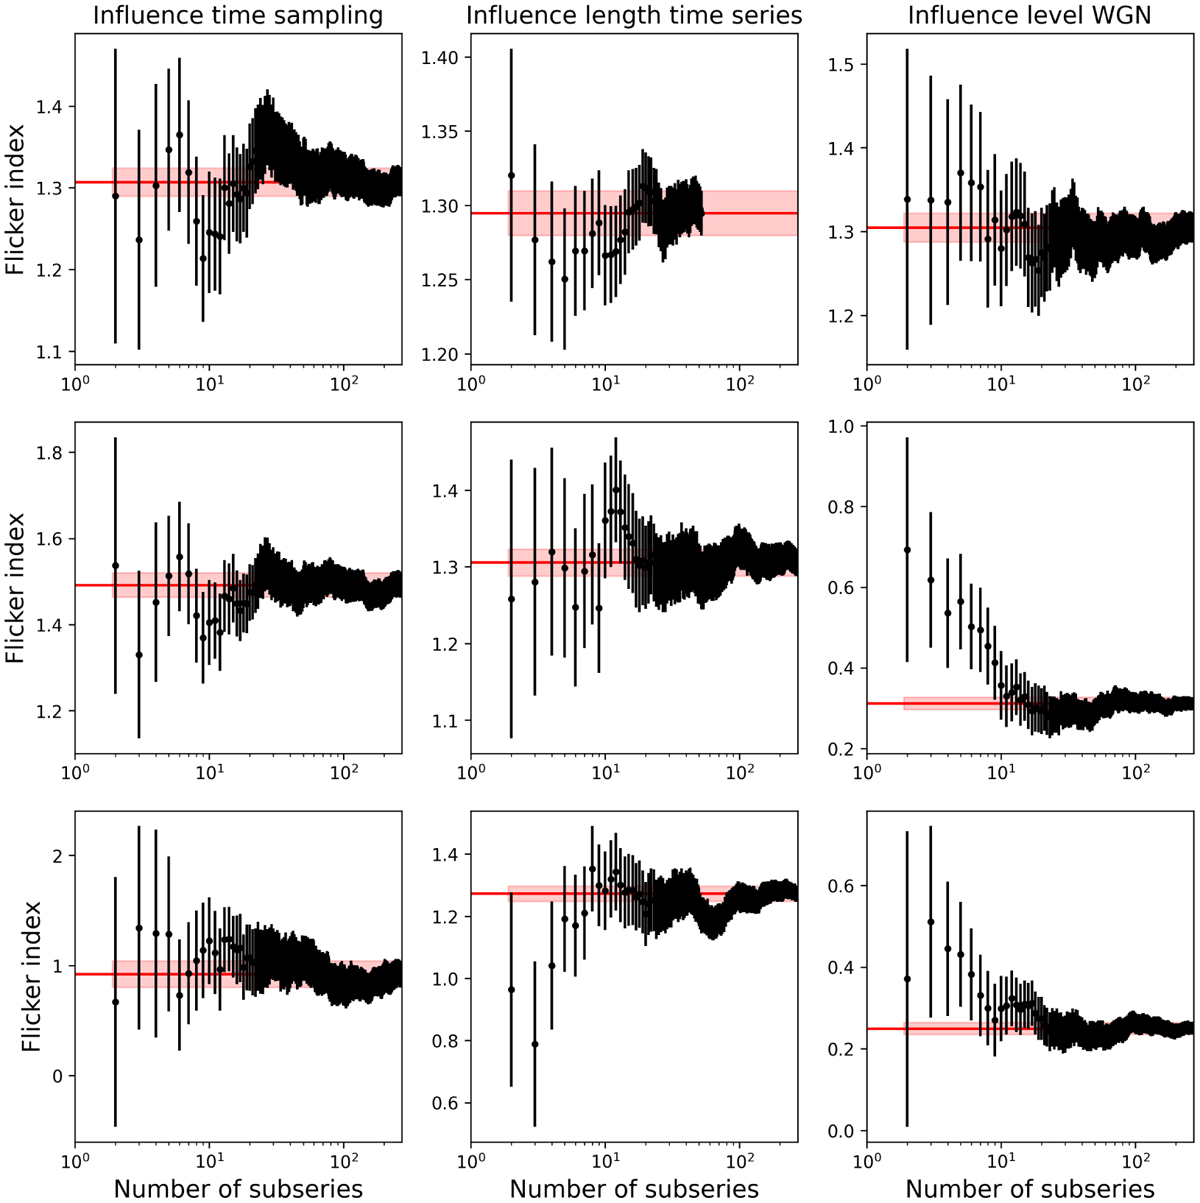
Inferred flicker indexes as a function of the number of subseries (L) used to compute the averaged periodogram in Eq. (3) based on VIRGO solar data. Left column: influence of the time sampling, Δt = 1, 5, 10 min (from top to bottom). Middle column: influence of the duration of the subseries, T = 5 day, 1 day, 8-hours (from top to bottom). Right column: influence of the high-frequency noise level, σW < 30 ppm (VIRGO data, top), σW = 82 ppm (level measured on CHEOPS HD 67458 periodogram), σW = 92 ppm (approximately the level measured on TESS HD 67458 periodogram). The red horizontal line indicates the flicker index value for large L (αɡ,∞).
Current usage metrics show cumulative count of Article Views (full-text article views including HTML views, PDF and ePub downloads, according to the available data) and Abstracts Views on Vision4Press platform.
Data correspond to usage on the plateform after 2015. The current usage metrics is available 48-96 hours after online publication and is updated daily on week days.
Initial download of the metrics may take a while.