Fig. 14
Download original image
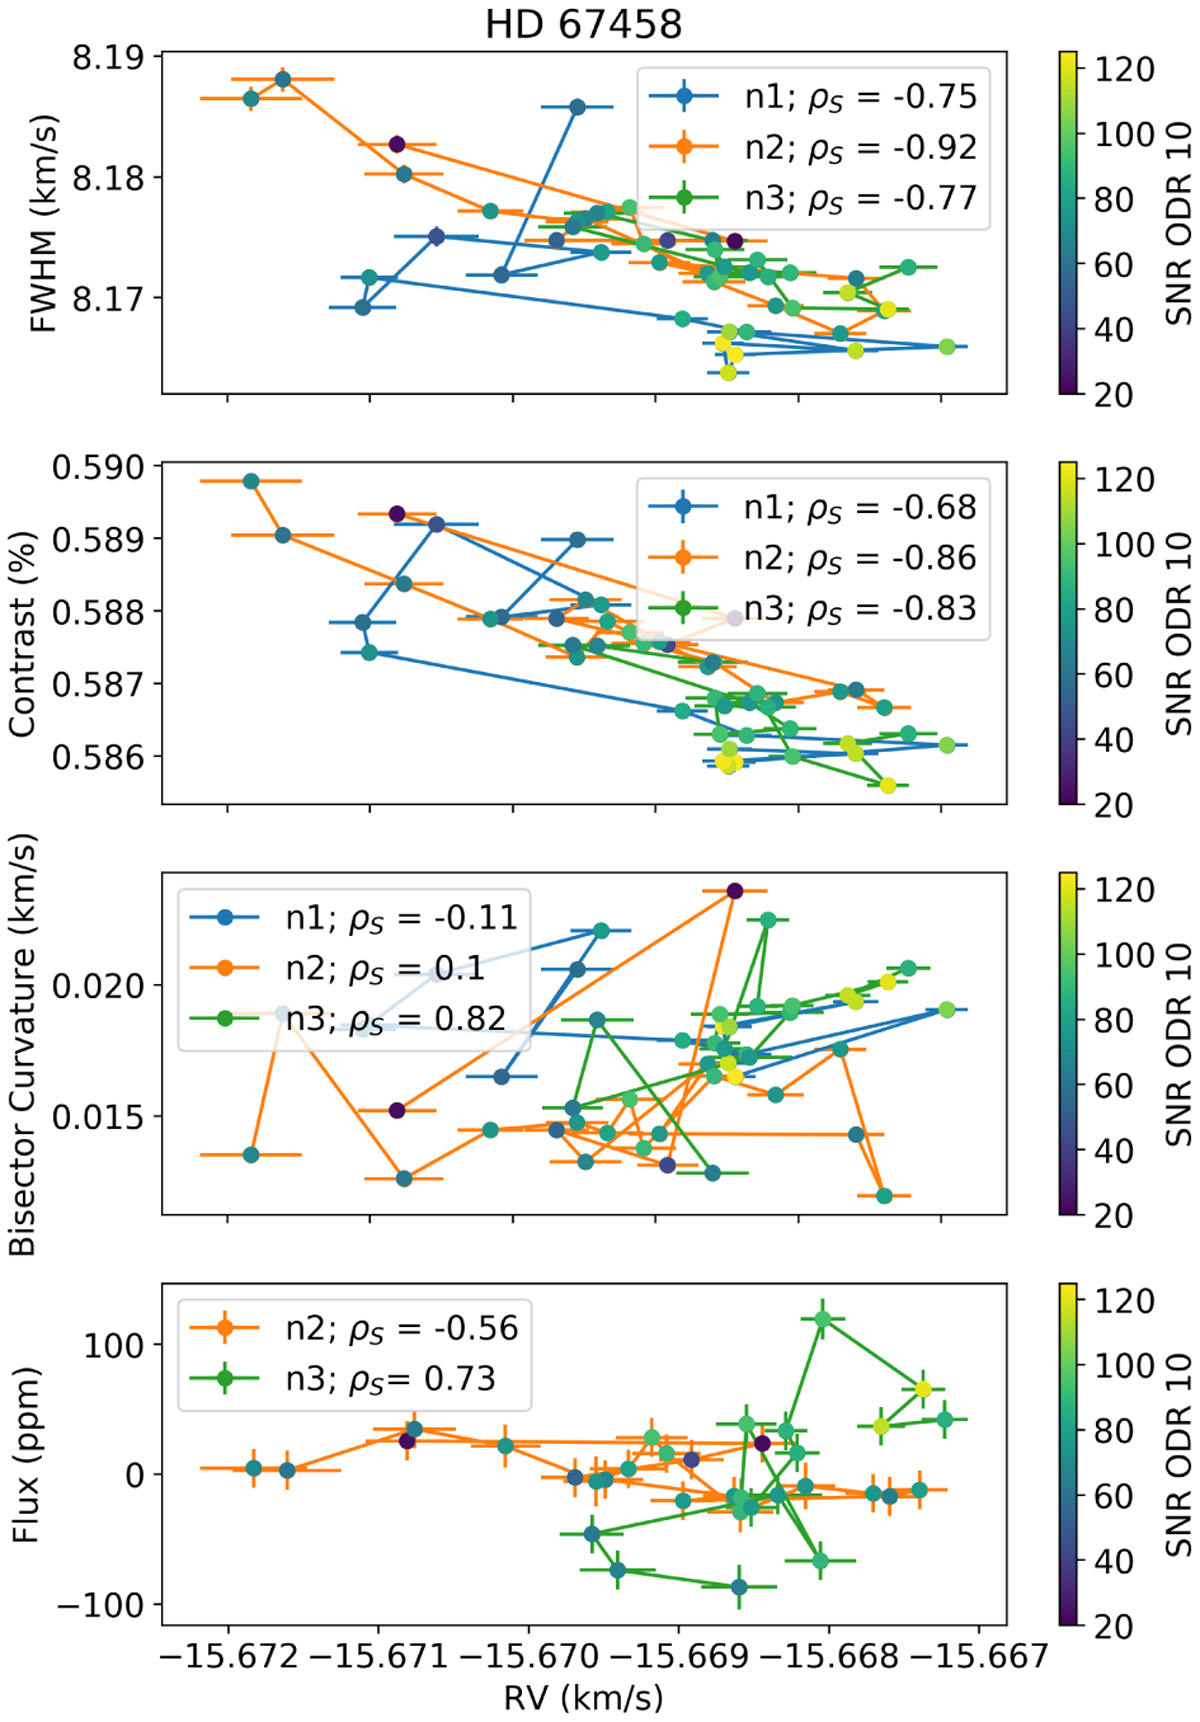
Relationship between various shape indicators and brightness (y-axis) vs. RV for HD 67458 shown as individual data points for CCFs binned in 20 min time intervals, where errorbar color, and lines connecting data in time, indicates the night of the observation (nl,n2,nЗ). Each point is color-coded by the average S/N of the 10th echelle order. The Spearman’s correlation coefficients is indicated by ρs for each night.
Current usage metrics show cumulative count of Article Views (full-text article views including HTML views, PDF and ePub downloads, according to the available data) and Abstracts Views on Vision4Press platform.
Data correspond to usage on the plateform after 2015. The current usage metrics is available 48-96 hours after online publication and is updated daily on week days.
Initial download of the metrics may take a while.