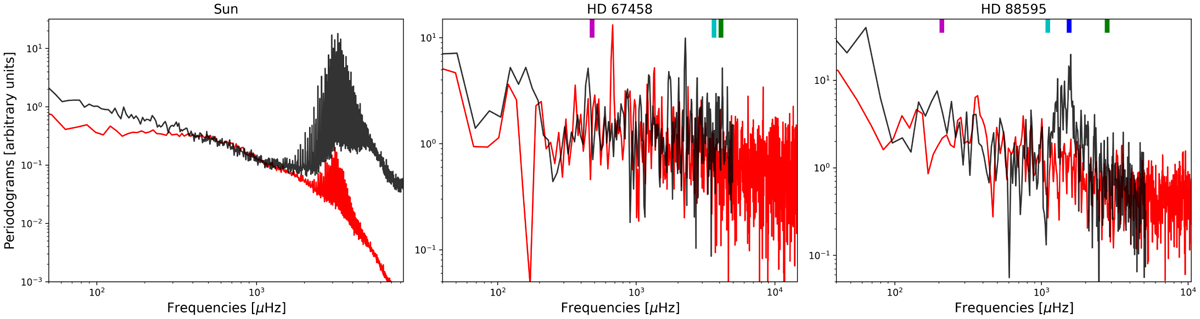
Fig. 12
Download original image
Comparison of the averaged periodograms of photometric (red) and spectroscopic (black) observations. Left: Solar VIRGO (red SPM channel) and GOLF observations. Middle: CHEOPS and ESPRESSO observations of HD 67458. Right: same for HD 88595. The periodograms have been arbitrarily normalized to compare their slope in the frequency regime that is dominated by stellar granulation. When relevant, the different cut-off frequencies vcut, vmax, fH, and fg represented by the green, blue, cyan and magenta vertical lines, respectively.
Current usage metrics show cumulative count of Article Views (full-text article views including HTML views, PDF and ePub downloads, according to the available data) and Abstracts Views on Vision4Press platform.
Data correspond to usage on the plateform after 2015. The current usage metrics is available 48-96 hours after online publication and is updated daily on week days.
Initial download of the metrics may take a while.