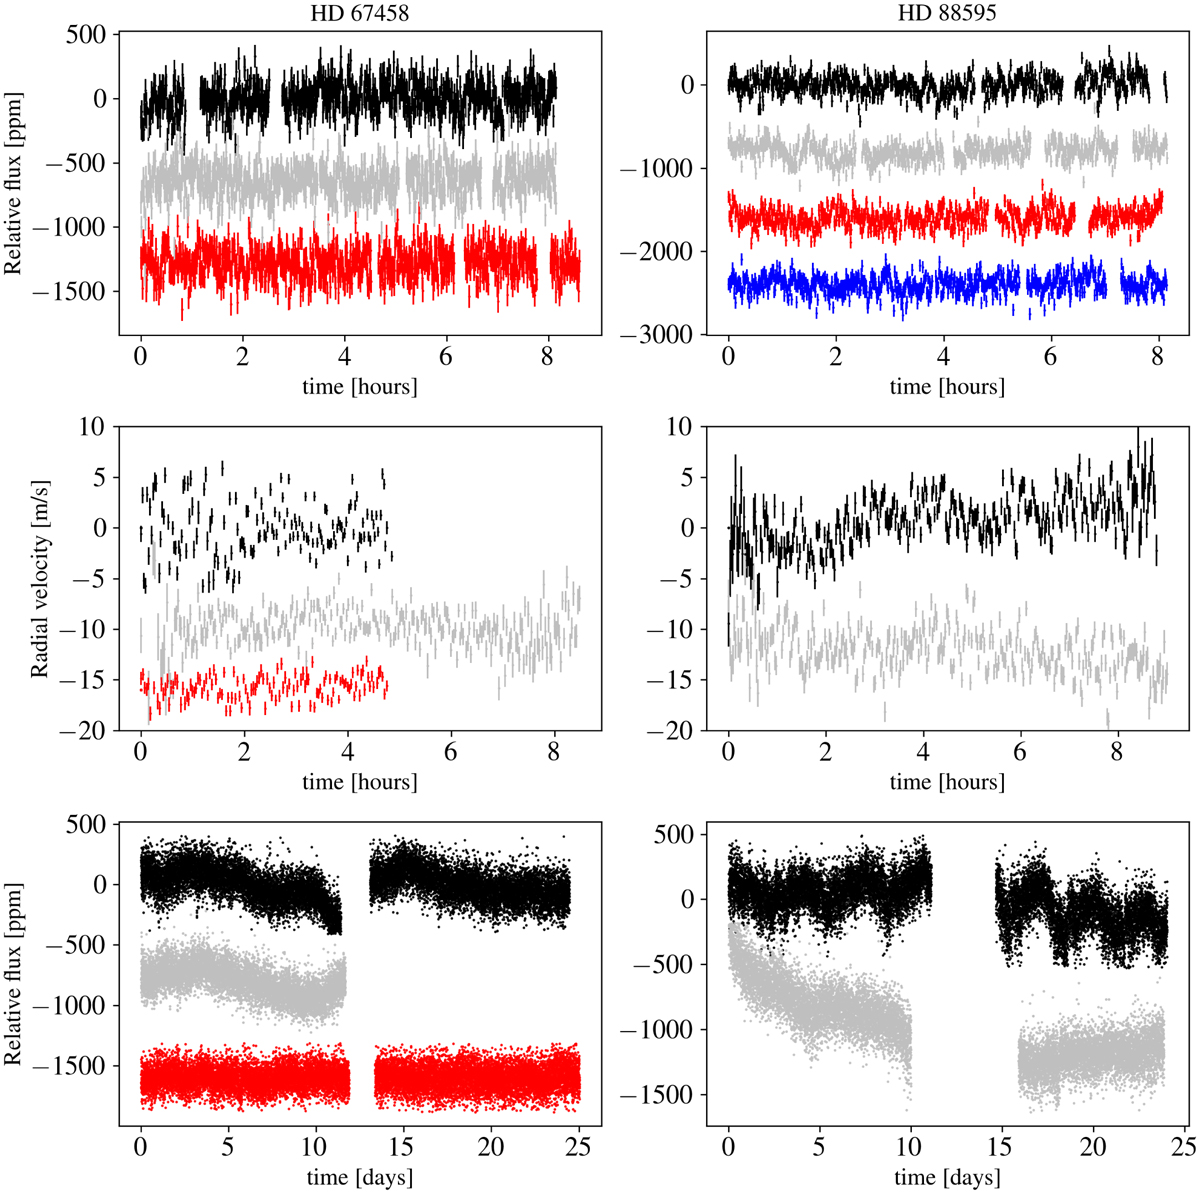
Fig. 1
Download original image
Detrended CHEOPS light curves (top row), ESPRESSO radial velocity time series (middle row), and TESS light curves (bottom row) for HD 67458 (leftpanels) and HD 88595 (right panels). In each panel, the colors indicate a different set of observations (CHEOPS visits, ESPRESSO nights, TESS sectors). Observations are y-shifted for visibility, and the dates of each time series are normalized to start at 0 (with a display that goes from the earliest date on the top, to the latest one on the bottom).
Current usage metrics show cumulative count of Article Views (full-text article views including HTML views, PDF and ePub downloads, according to the available data) and Abstracts Views on Vision4Press platform.
Data correspond to usage on the plateform after 2015. The current usage metrics is available 48-96 hours after online publication and is updated daily on week days.
Initial download of the metrics may take a while.