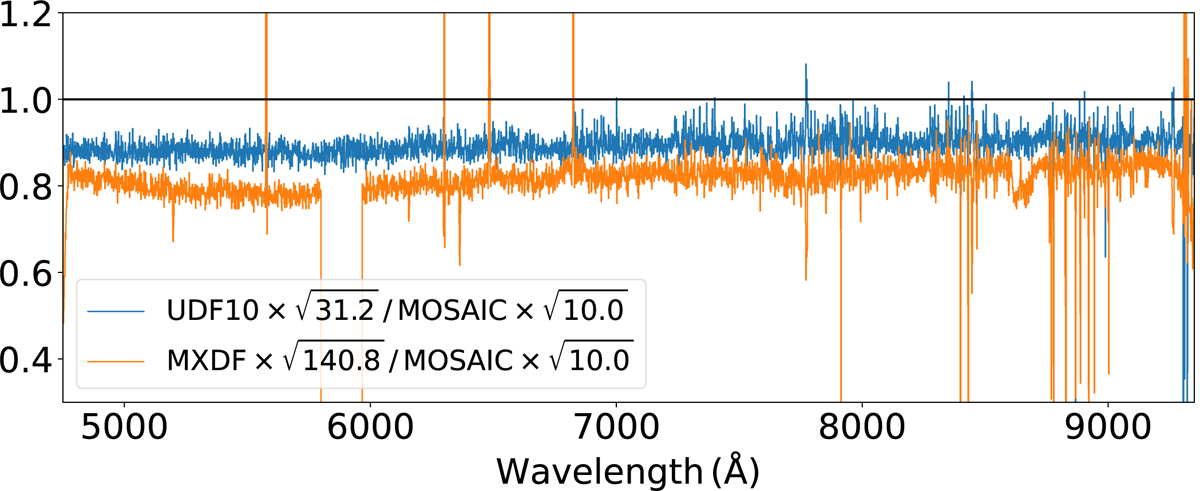
Fig. 9.
Download original image
Scaled raw noise comparison between the three data sets. The plot displays the UDF-10 and MXDF to MOSAIC scaled noise ratio. The scaled noise is computed as the median noise level for each data set in a common set of 1″ empty apertures, after scaling by the square root of the depth in hours. We note that the noise level has not been corrected for correlations caused by the interpolation.
Current usage metrics show cumulative count of Article Views (full-text article views including HTML views, PDF and ePub downloads, according to the available data) and Abstracts Views on Vision4Press platform.
Data correspond to usage on the plateform after 2015. The current usage metrics is available 48-96 hours after online publication and is updated daily on week days.
Initial download of the metrics may take a while.