Fig. 8.
Download original image
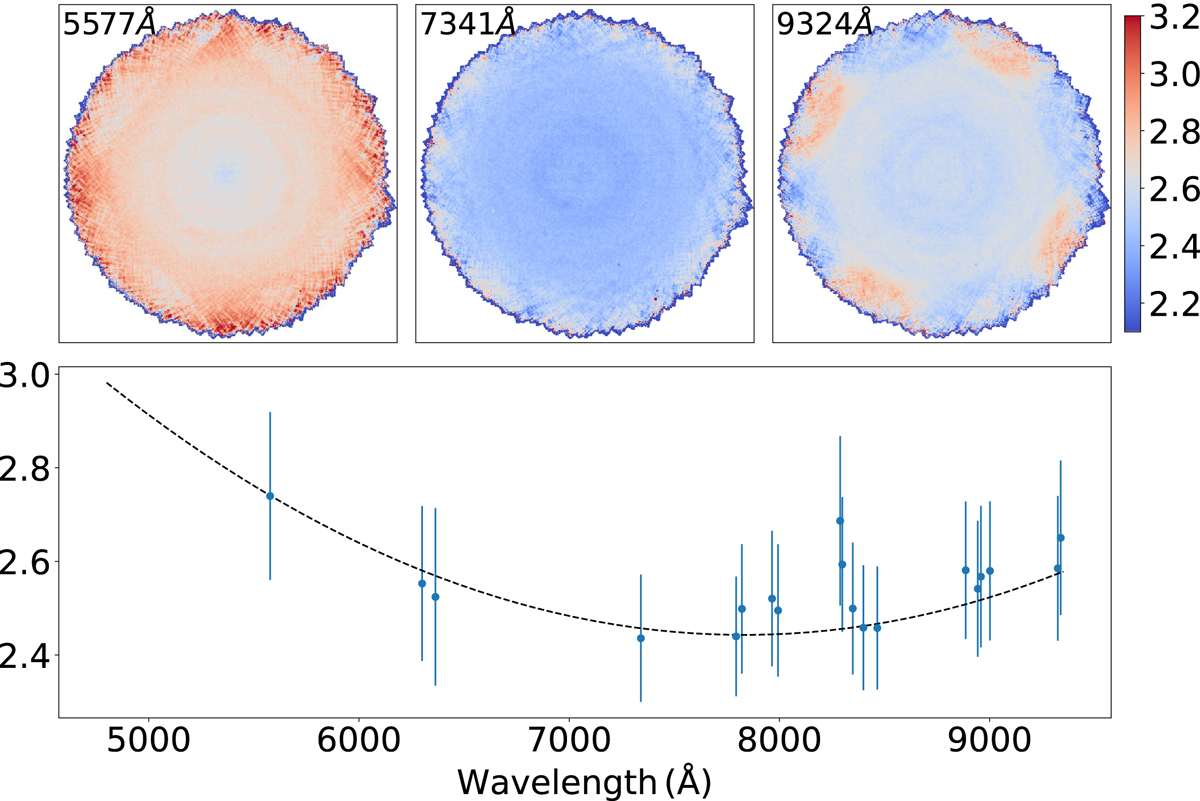
Measurements of the MXDF LSF in the combined datacube (not sky subtracted). The bottom panel displays the fitted Gaussian FWHM for a few bright sky lines. Variations with the field of view are given by the error bars (standard deviation). The DR1 UDF-10 polynomial approximation is shown as a dashed line. Examples of FWHM spatial maps are given for three sky lines in the top panels. FWHM units is Å.
Current usage metrics show cumulative count of Article Views (full-text article views including HTML views, PDF and ePub downloads, according to the available data) and Abstracts Views on Vision4Press platform.
Data correspond to usage on the plateform after 2015. The current usage metrics is available 48-96 hours after online publication and is updated daily on week days.
Initial download of the metrics may take a while.