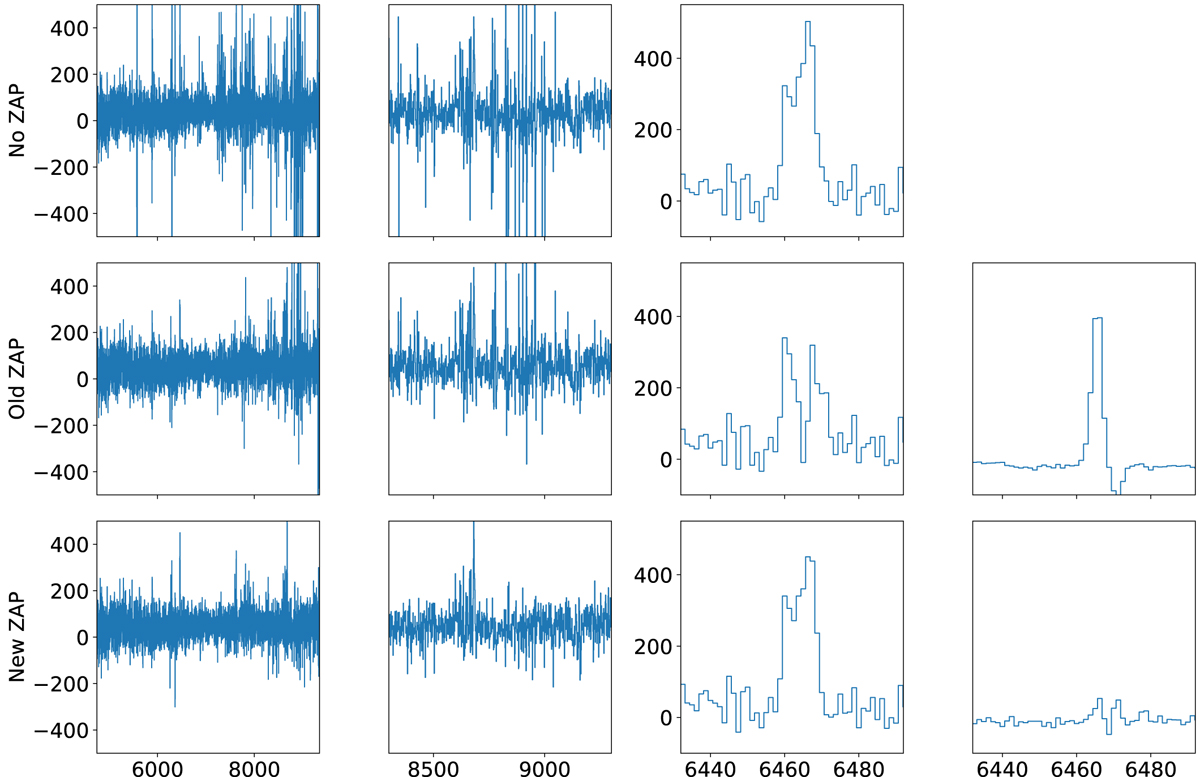
Fig. B.2.
Download original image
Example of improved performance of the new ZAP version. The top, middle and bottom rows display respectively the non-zapped, old zapped, and new zapped spectra of an [O II] emitter in the MXDF. From left to right, the columns display: the full spectral range, the red part of the spectra, the [O II]λλ3726,3729 emission lines and the difference with the no ZAP spectrum. Flux units are 10−20 erg s−1 cm−2 Å−1.
Current usage metrics show cumulative count of Article Views (full-text article views including HTML views, PDF and ePub downloads, according to the available data) and Abstracts Views on Vision4Press platform.
Data correspond to usage on the plateform after 2015. The current usage metrics is available 48-96 hours after online publication and is updated daily on week days.
Initial download of the metrics may take a while.