Fig. 4.
Download original image
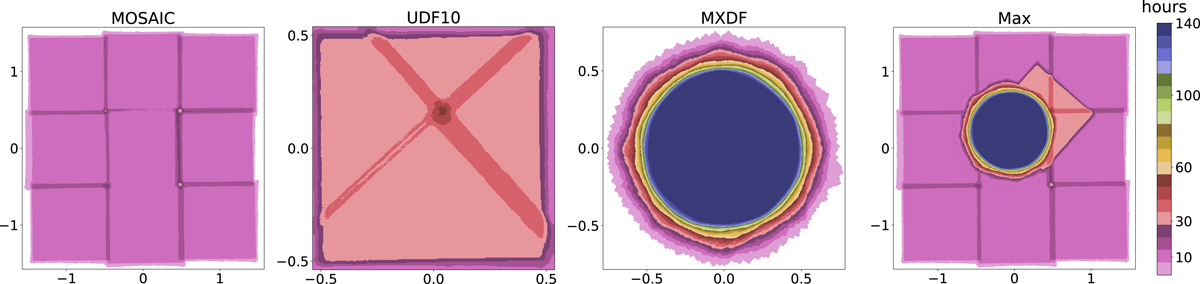
Achieved depth in hours. The MOSAIC, UDF-10, and MXDF exposure maps are shown in the first three panels, starting from the left. The Max exposure map, computed as the maximum depth for each spaxel, is shown in the right panel. UDF-10 and MXDF are to the north (top) and the east (left), respectively, while the MOSAIC and Max exposure maps are rotated by 42° (see Fig. 2). Axis labels are in arcmin.
Current usage metrics show cumulative count of Article Views (full-text article views including HTML views, PDF and ePub downloads, according to the available data) and Abstracts Views on Vision4Press platform.
Data correspond to usage on the plateform after 2015. The current usage metrics is available 48-96 hours after online publication and is updated daily on week days.
Initial download of the metrics may take a while.