Fig. 35.
Download original image
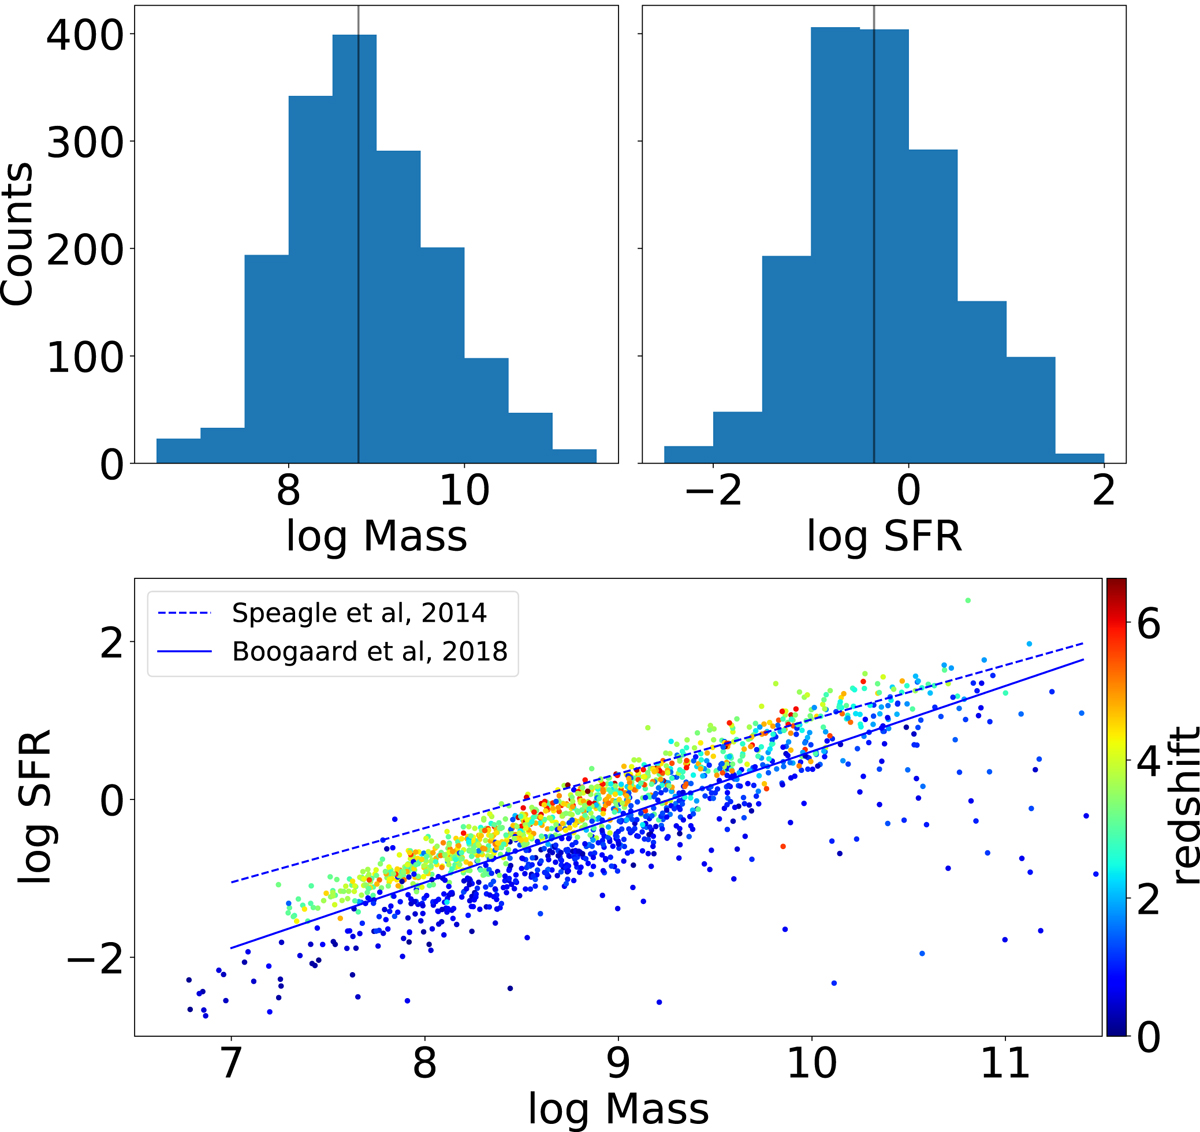
Stellar mass (top left panel) and SFR (top right panel) distributions for the MUSE galaxies identified in the R15 catalog. Values are given for the Prospector SED fit in the ≈100 Myr lookback time. The stellar mass and the SFR are in log M⊙ and log M⊙ yr−1 units, respectively. The vertical black lines show the median values of the distributions. The bottom panel displays the star forming galaxies main sequence log SFR(log M). Symbols are colored according to the redshift. The z = 1 main sequence derived by Boogaard et al. (2018) and Speagle et al. (2014) are shown as blue solid and dashed lines, respectively. See the main text for a discussion of the offset from our inferred values.
Current usage metrics show cumulative count of Article Views (full-text article views including HTML views, PDF and ePub downloads, according to the available data) and Abstracts Views on Vision4Press platform.
Data correspond to usage on the plateform after 2015. The current usage metrics is available 48-96 hours after online publication and is updated daily on week days.
Initial download of the metrics may take a while.