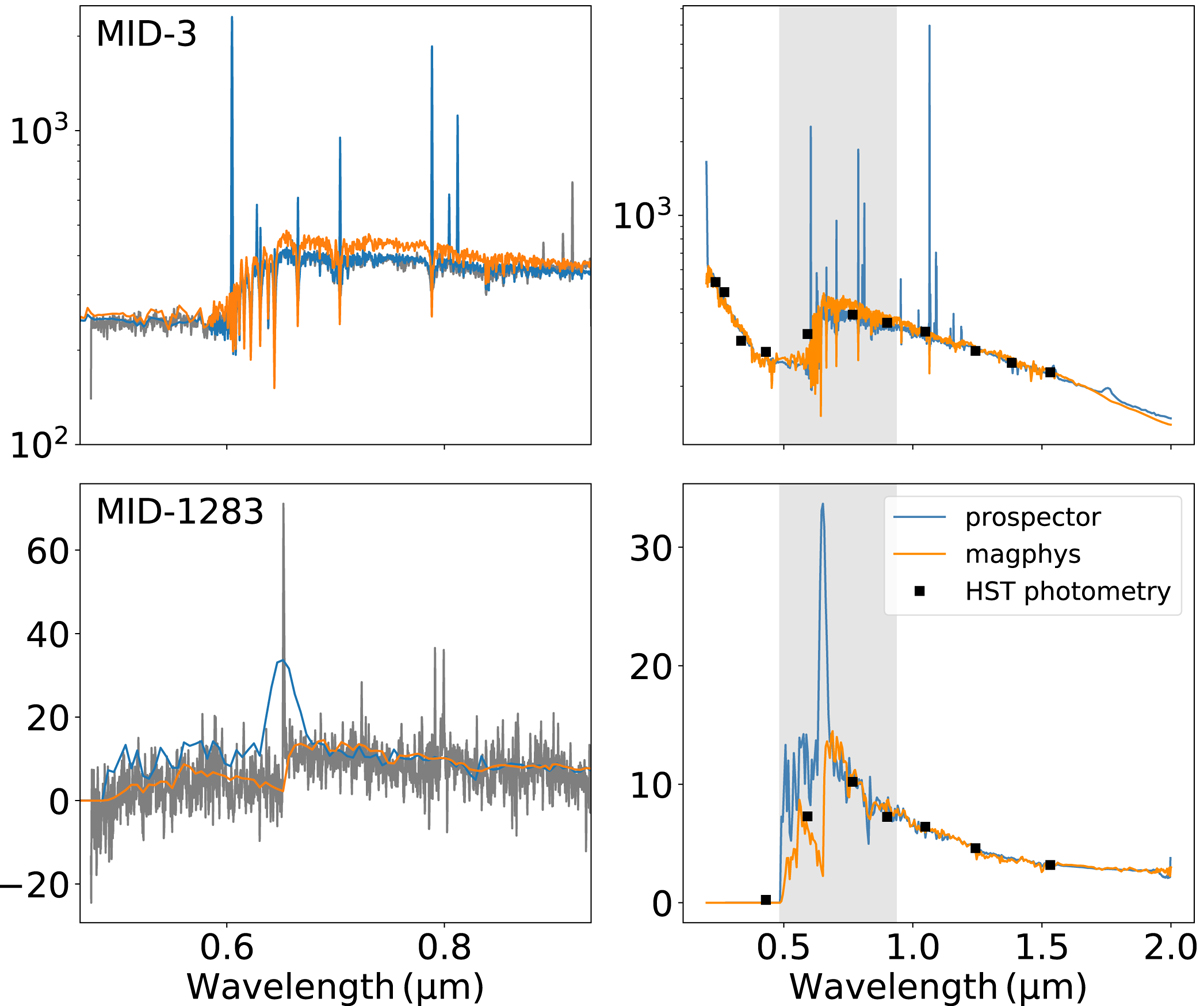
Fig. 33.
Download original image
Two example SED fits: the z = 0.62 MID-3 [O II] emitter (top panels) and the z = 4.36 MID-1283 Lyα emitter (bottom panels). The left column shows the MUSE spectrum (in black) and the Prospector (blue line) and Magphys (orange line) SED fits. The right column displays the SED fits and the HST R15 photometry (black symbols). The shaded area in the right column indicates the MUSE wavelength range. Flux and wavelength units are 10−20 erg s−1 cm−2 Å−1 and μm, respectively.
Current usage metrics show cumulative count of Article Views (full-text article views including HTML views, PDF and ePub downloads, according to the available data) and Abstracts Views on Vision4Press platform.
Data correspond to usage on the plateform after 2015. The current usage metrics is available 48-96 hours after online publication and is updated daily on week days.
Initial download of the metrics may take a while.