Fig. 30.
Download original image
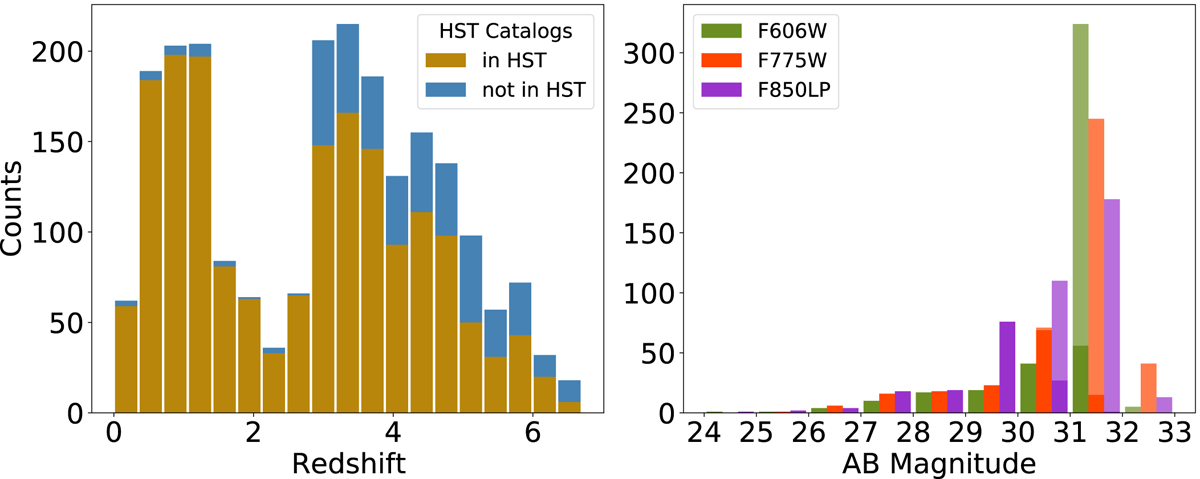
Statistics of MUSE sources without HST counterpart. Left panel: comparison of the redshift distributions of MUSE sources with (brown color) and without (blue color) HST counterparts. Right panel: estimated AB aperture magnitude for MUSE sources without HST counterparts. The histogram is colored according to the HST filters. Successful photometric measurements (S/N > 3) are displayed in dark colors, while measurements with S/N < 3 are displayed with light colors. In the latter case the reported magnitude is the measured noise RMS standard deviation.
Current usage metrics show cumulative count of Article Views (full-text article views including HTML views, PDF and ePub downloads, according to the available data) and Abstracts Views on Vision4Press platform.
Data correspond to usage on the plateform after 2015. The current usage metrics is available 48-96 hours after online publication and is updated daily on week days.
Initial download of the metrics may take a while.