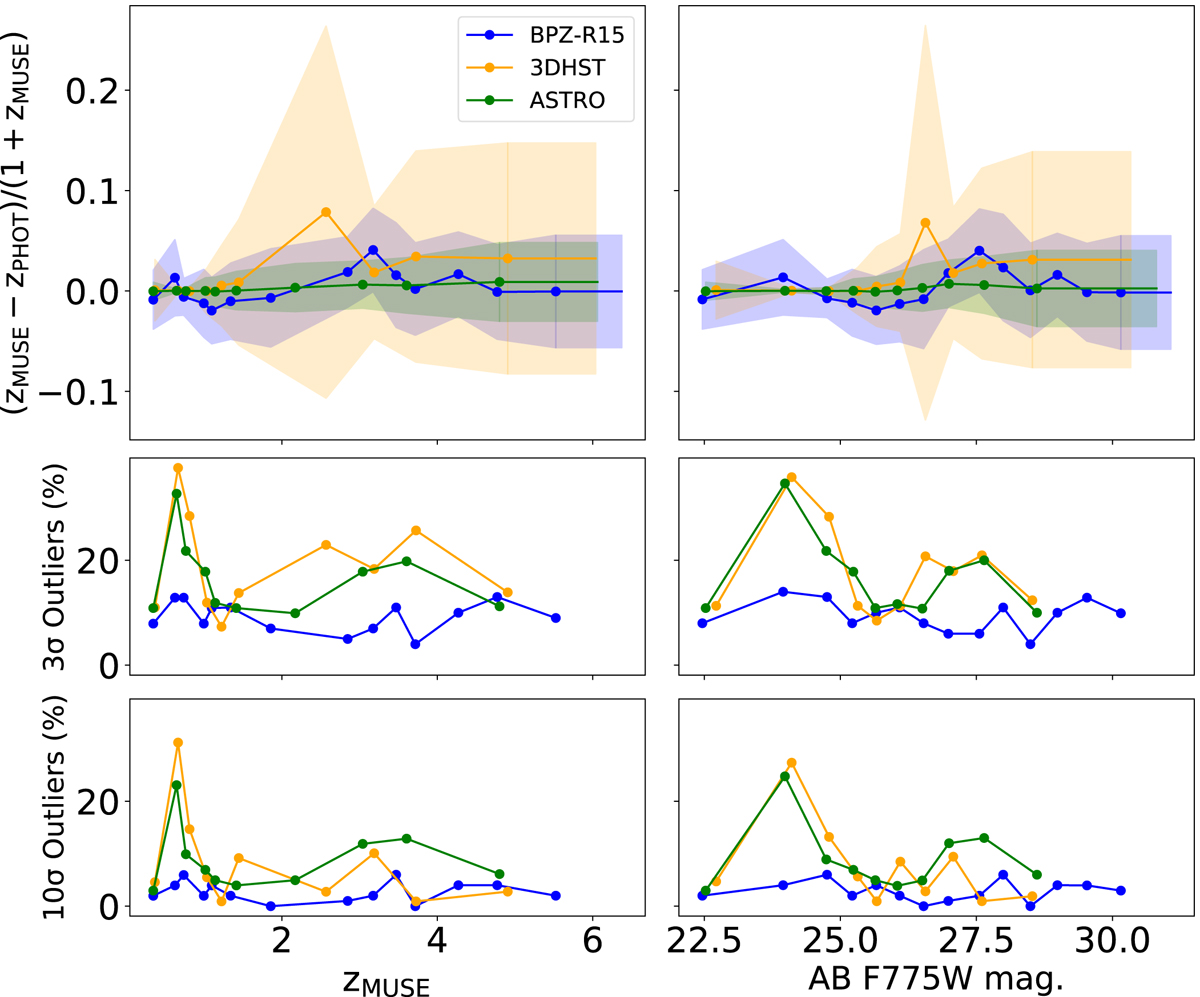
Fig. 29.
Download original image
Redshift off-set between spectroscopic redshifts from MUSE and the photometric redshifts from Rafelski et al. (2015) BPZ-R15 (blue), Momcheva et al. (2016) 3D-HST (orange) and Merlin et al. (2021) ASTRODEEP (green) catalogs, all normalized by 1 + zMUSE. The top left panel show the median (solid line) as a function of redshift and the scatter on the median is shown by the shaded areas. The middle and bottom left panels show the fraction of outliers at respectively 3σ and 10σ. The right panels display the same quantities as a function of HST F775W AB magnitude.
Current usage metrics show cumulative count of Article Views (full-text article views including HTML views, PDF and ePub downloads, according to the available data) and Abstracts Views on Vision4Press platform.
Data correspond to usage on the plateform after 2015. The current usage metrics is available 48-96 hours after online publication and is updated daily on week days.
Initial download of the metrics may take a while.