Fig. 26.
Download original image
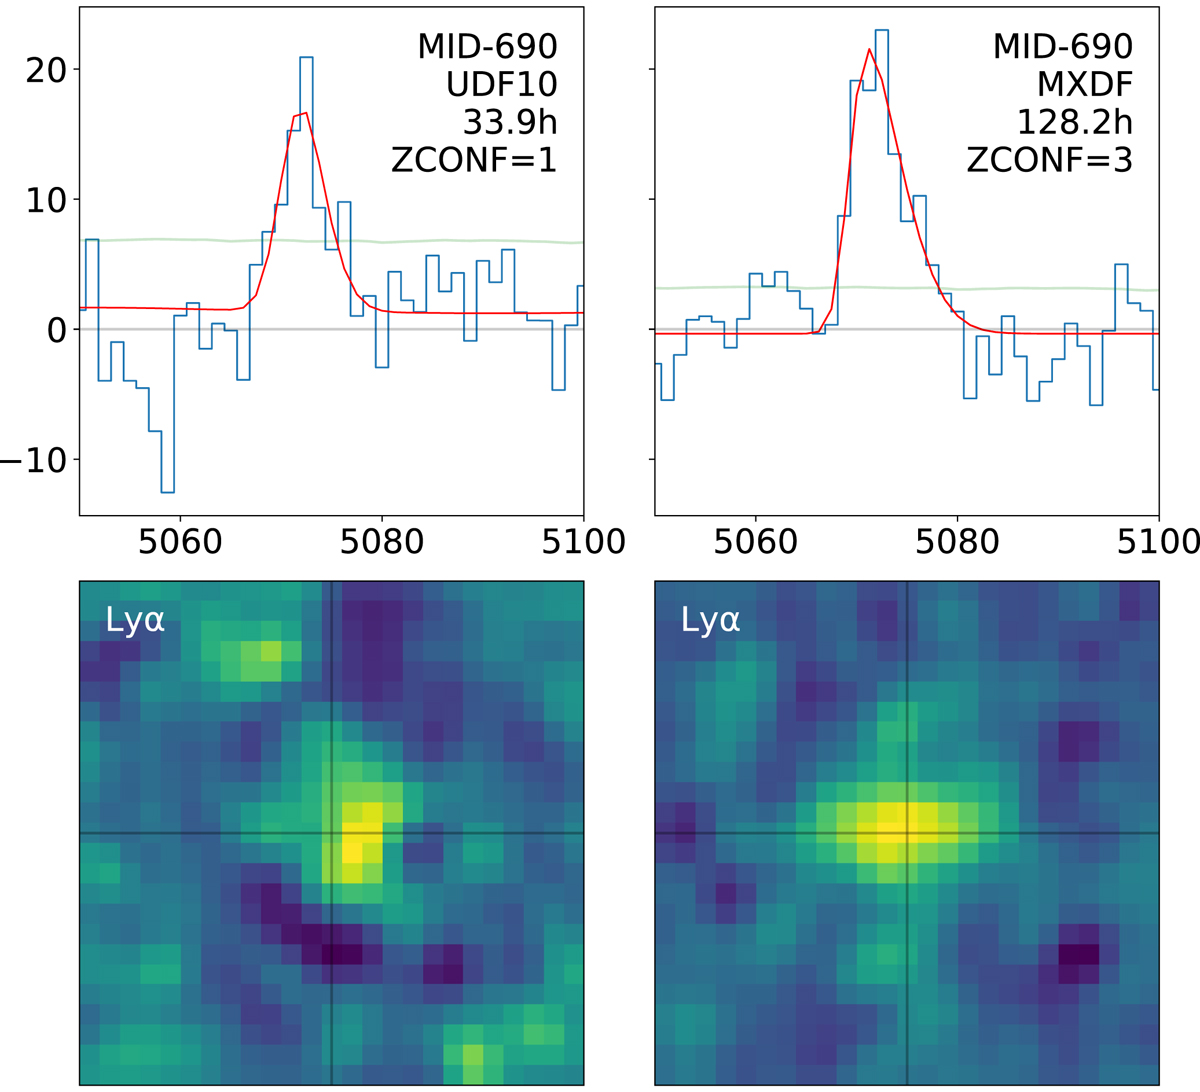
Impact of depth on the redshift confidence assignment. The Lyα line (data in blue color, fit in red color) and the corresponding narrowband image of the Lyα emitter MID-690 are shown for the UDF-10 (left column) and the MXDF (right column) data sets. The green curves display the noise standard deviation. The narrow bands have been smoothed with a Gaussian of 0.5″ FWHM. Image sizes are 5″ × 5″. Observed wavelength and flux units are respectively Å and 10−20 erg s−1 cm−2 Å−1.
Current usage metrics show cumulative count of Article Views (full-text article views including HTML views, PDF and ePub downloads, according to the available data) and Abstracts Views on Vision4Press platform.
Data correspond to usage on the plateform after 2015. The current usage metrics is available 48-96 hours after online publication and is updated daily on week days.
Initial download of the metrics may take a while.