Fig. 25.
Download original image
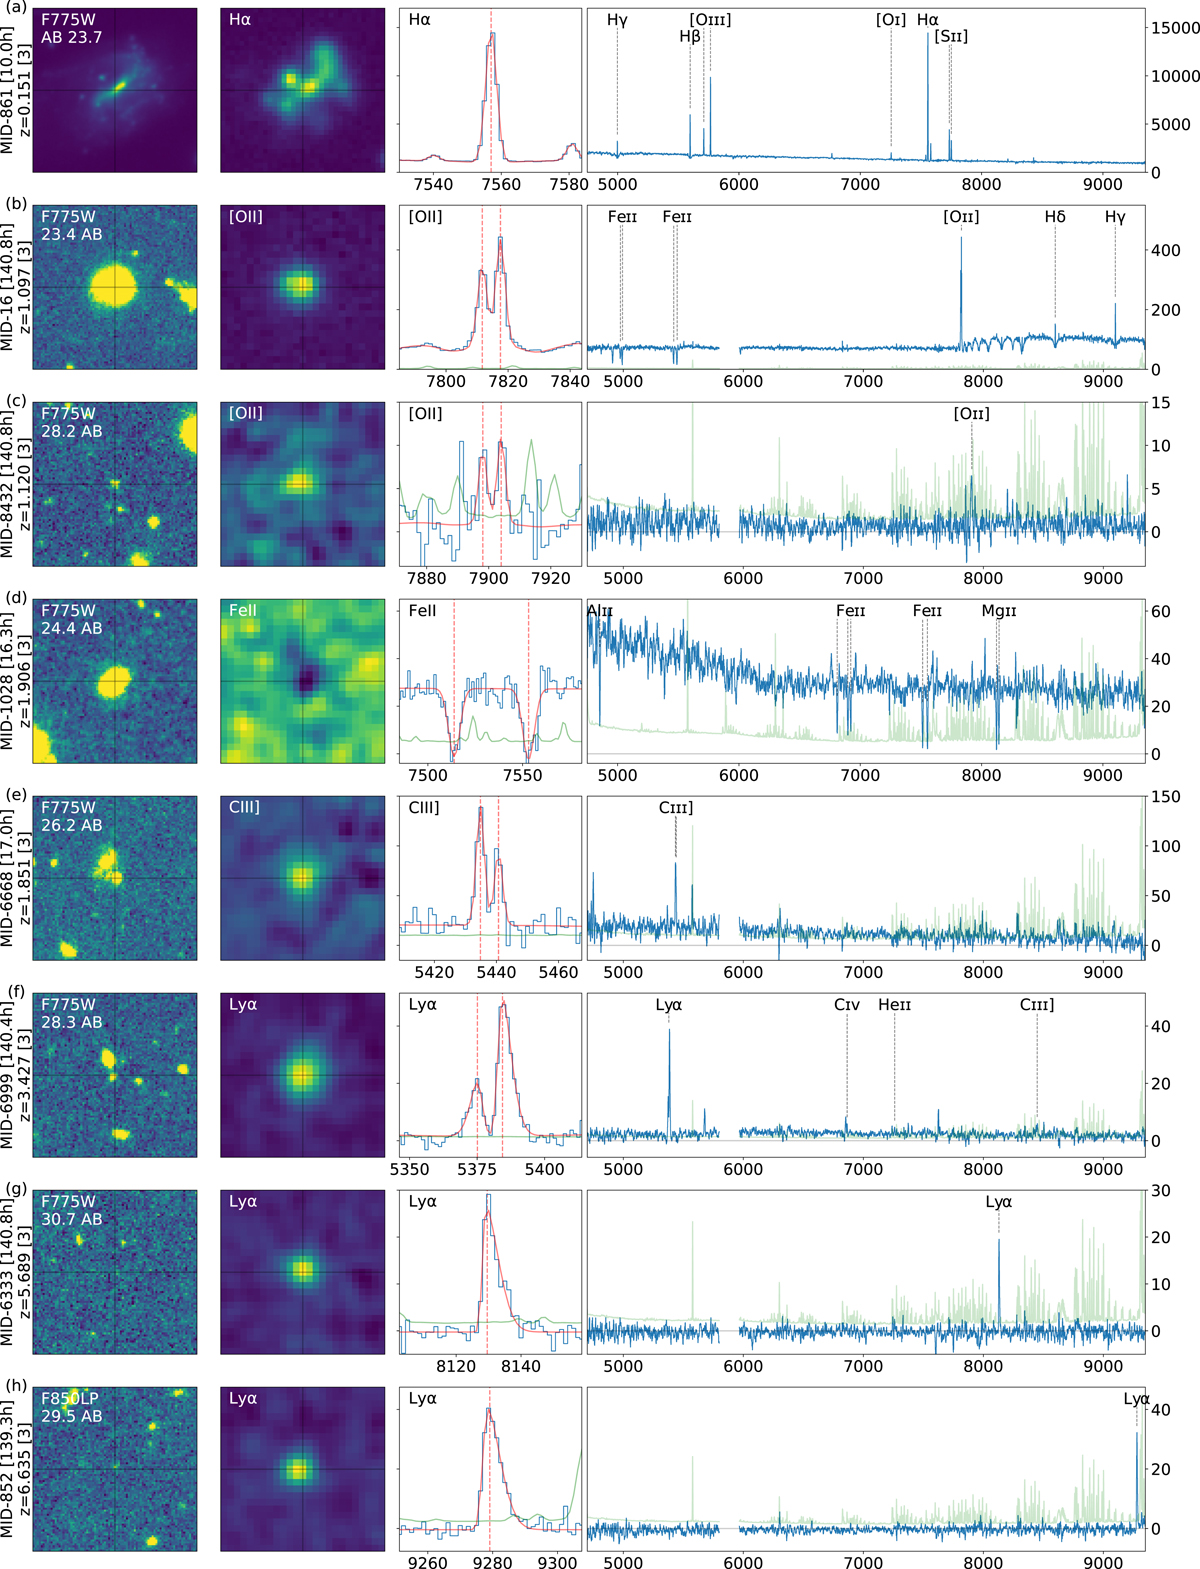
Examples of sources. From left to right the columns display (1) the HST image in the F775W or F850LP filter (2) the emission or absorption narrowband for the main line (3) the spectrum zoomed-in on the main line (in blue) and its fit (in red) (4) the full spectrum (in blue). The green curves show the noise standard deviation. Except for the first two sources, the narrowband images and the full spectra have been filtered with respectively a Gaussian of 0.5″ FWHM and a box filter of 5 pixels. Image sizes are 5″ × 5″. Observed wavelengths are in Å and the flux unit is 10−20 erg s−1 cm−2 Å−1. For each source the MUSE identifier, depth in hours, redshift value and confidence, and AB HST magnitude are indicated.
Current usage metrics show cumulative count of Article Views (full-text article views including HTML views, PDF and ePub downloads, according to the available data) and Abstracts Views on Vision4Press platform.
Data correspond to usage on the plateform after 2015. The current usage metrics is available 48-96 hours after online publication and is updated daily on week days.
Initial download of the metrics may take a while.