Fig. 24.
Download original image
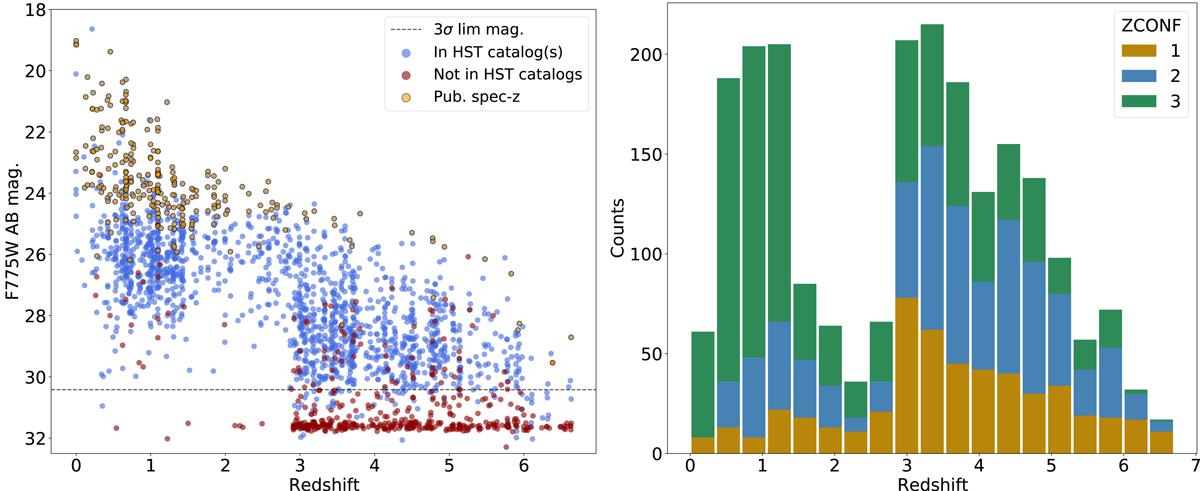
Redshift distribution of the MUSE data release II. The magnitude – redshift scatter plot is displayed on the left panel. All MUSE sources with an HST counterpart in at least one of the HST catalogs are shown as blue symbols. We note that objects with low S/N in F775W could still be in HST catalogs if they are detected in another filter (e.g., NIR filters for high-z objects). The matched spectroscopic redshifts previously published (Sect. 6.1.3) are shown as yellow circles. For sources without catalog HST counterparts, the brown circles show the 0![]() 4 aperture magnitude as measured on the HST F775 image (cf. Sect. 6.2). The horizontal dashed line indicates the median F775W 3σ limiting magnitude. The redshift histogram, colored by redshift confidence, is presented in the right panel.
4 aperture magnitude as measured on the HST F775 image (cf. Sect. 6.2). The horizontal dashed line indicates the median F775W 3σ limiting magnitude. The redshift histogram, colored by redshift confidence, is presented in the right panel.
Current usage metrics show cumulative count of Article Views (full-text article views including HTML views, PDF and ePub downloads, according to the available data) and Abstracts Views on Vision4Press platform.
Data correspond to usage on the plateform after 2015. The current usage metrics is available 48-96 hours after online publication and is updated daily on week days.
Initial download of the metrics may take a while.