Fig. 23.
Download original image
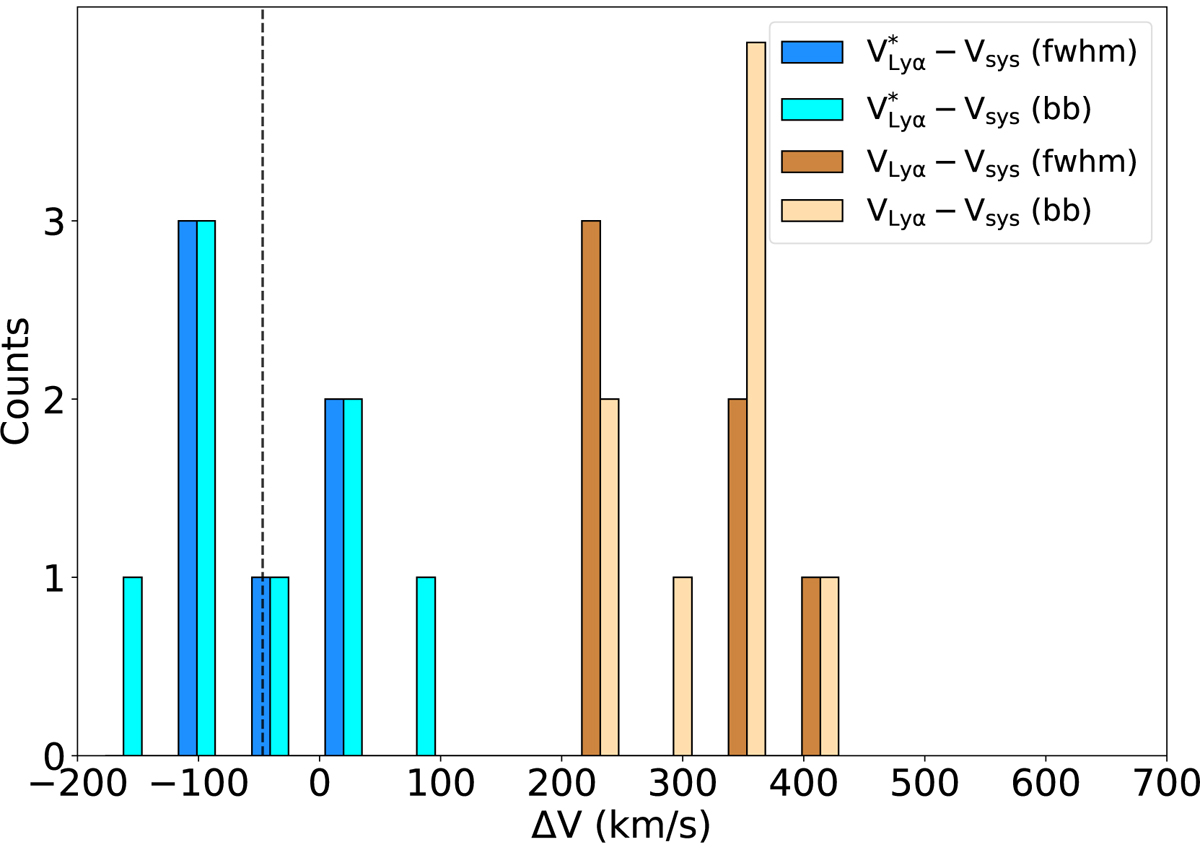
Check of systemic redshift correction for a subsample of DR2 Lyα emitters with systemic redshifts measurements. The histogram of the rest-frame velocity difference between the measured Lyα red peak location (VLyα) and the systemic velocity (Vsys) is shown in orange. The same histogram after systemic velocity correction (![]() ) is shown in blue. The type of correction, that is, blue bump separation (bb) or Lyα line FWHM (fwhm), are identified in respectively darker and lighter colors. The dashed vertical line displays the median value of the velocity offset distribution after correction (−47 km s−1).
) is shown in blue. The type of correction, that is, blue bump separation (bb) or Lyα line FWHM (fwhm), are identified in respectively darker and lighter colors. The dashed vertical line displays the median value of the velocity offset distribution after correction (−47 km s−1).
Current usage metrics show cumulative count of Article Views (full-text article views including HTML views, PDF and ePub downloads, according to the available data) and Abstracts Views on Vision4Press platform.
Data correspond to usage on the plateform after 2015. The current usage metrics is available 48-96 hours after online publication and is updated daily on week days.
Initial download of the metrics may take a while.