Fig. 22.
Download original image
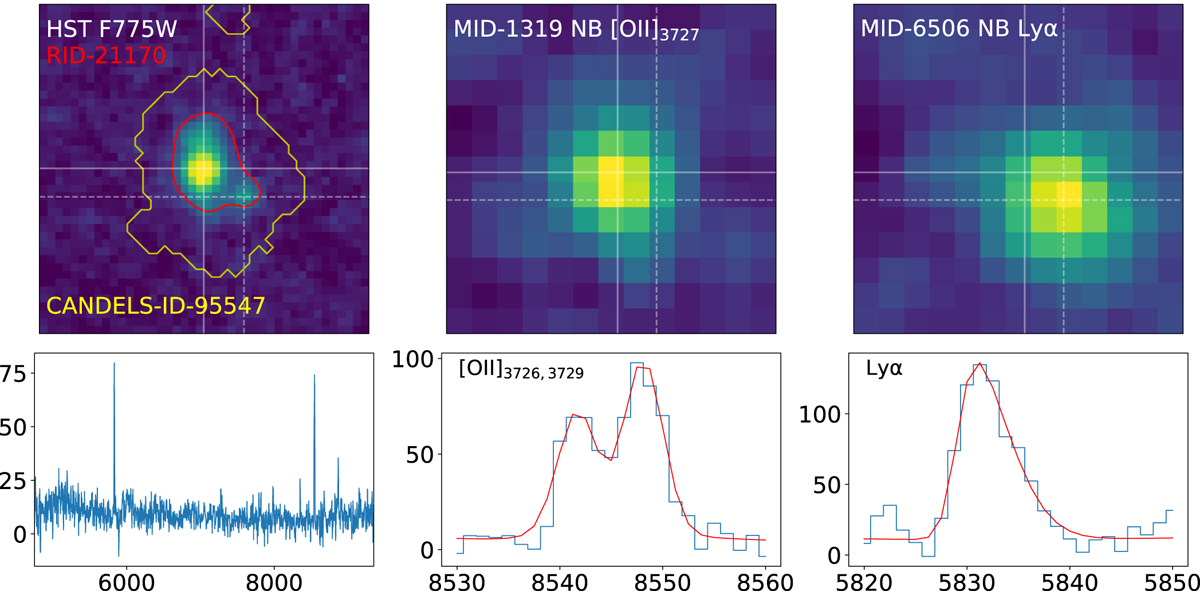
Example of a MUSE source missed in HST catalogs. The upper left panel display the HST F775W image (![]() ) at the location of RID-21170. The red line shows the R15 segmentation contour, while the yellow line displays the CANDELS v2 segmentation contour of the corresponding source (ID 95547) in Whitaker et al. (2019). Although all HST catalogs identify a single source, MUSE unambiguously identifies two sources: MID-1319, an [O II] emitter at z = 1.292 (bottom central panel) and MID-6506 (bottom right panel), a Lyα emitter at z = 3.798. The MUSE reference spectrum is shown in the bottom left panel. From the corresponding [O II] and Lyα narrowband images, one can see that the MID-1319 [O II] emitter matches the brighter part of the HST image, while the MID-6506 Lyα emitter coincides with the southeast secondary HST peak. Observed wavelength and flux units are respectively Å and 10−20 erg s−1 cm−2 Å−1.
) at the location of RID-21170. The red line shows the R15 segmentation contour, while the yellow line displays the CANDELS v2 segmentation contour of the corresponding source (ID 95547) in Whitaker et al. (2019). Although all HST catalogs identify a single source, MUSE unambiguously identifies two sources: MID-1319, an [O II] emitter at z = 1.292 (bottom central panel) and MID-6506 (bottom right panel), a Lyα emitter at z = 3.798. The MUSE reference spectrum is shown in the bottom left panel. From the corresponding [O II] and Lyα narrowband images, one can see that the MID-1319 [O II] emitter matches the brighter part of the HST image, while the MID-6506 Lyα emitter coincides with the southeast secondary HST peak. Observed wavelength and flux units are respectively Å and 10−20 erg s−1 cm−2 Å−1.
Current usage metrics show cumulative count of Article Views (full-text article views including HTML views, PDF and ePub downloads, according to the available data) and Abstracts Views on Vision4Press platform.
Data correspond to usage on the plateform after 2015. The current usage metrics is available 48-96 hours after online publication and is updated daily on week days.
Initial download of the metrics may take a while.