Fig. 21.
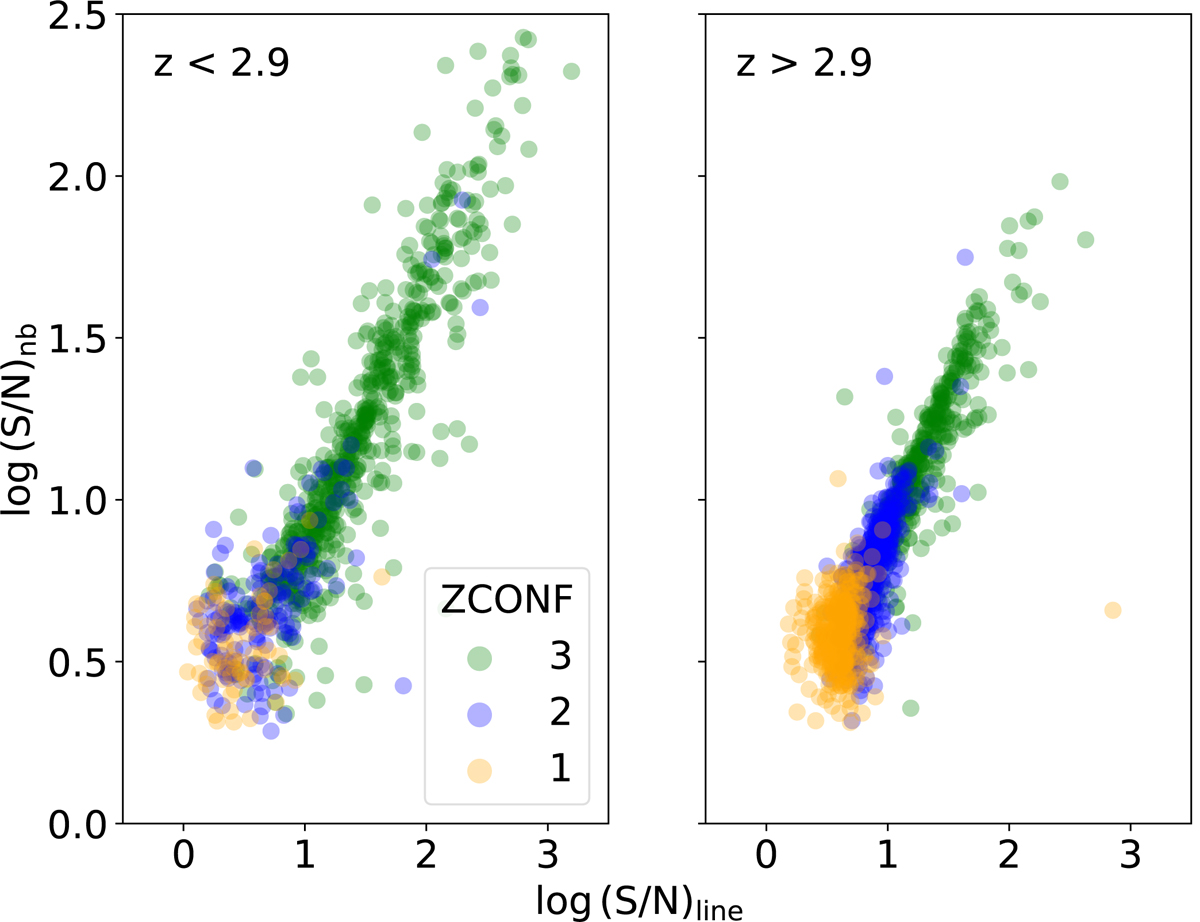
Download original image
S/N estimates as a function of redshift confidence. The log of the S/N emission or absorption composite narrowband is shown as a function of the log of the leading line S/N derived from pyPlatefit. Low (1), good (2) and high (3) redshift confidences are shown in respectively orange, blue and green colors, while low-z (z < 2.9) and high-z (z > 2.9) sources are displayed in the left and right panels, respectively.
Current usage metrics show cumulative count of Article Views (full-text article views including HTML views, PDF and ePub downloads, according to the available data) and Abstracts Views on Vision4Press platform.
Data correspond to usage on the plateform after 2015. The current usage metrics is available 48-96 hours after online publication and is updated daily on week days.
Initial download of the metrics may take a while.