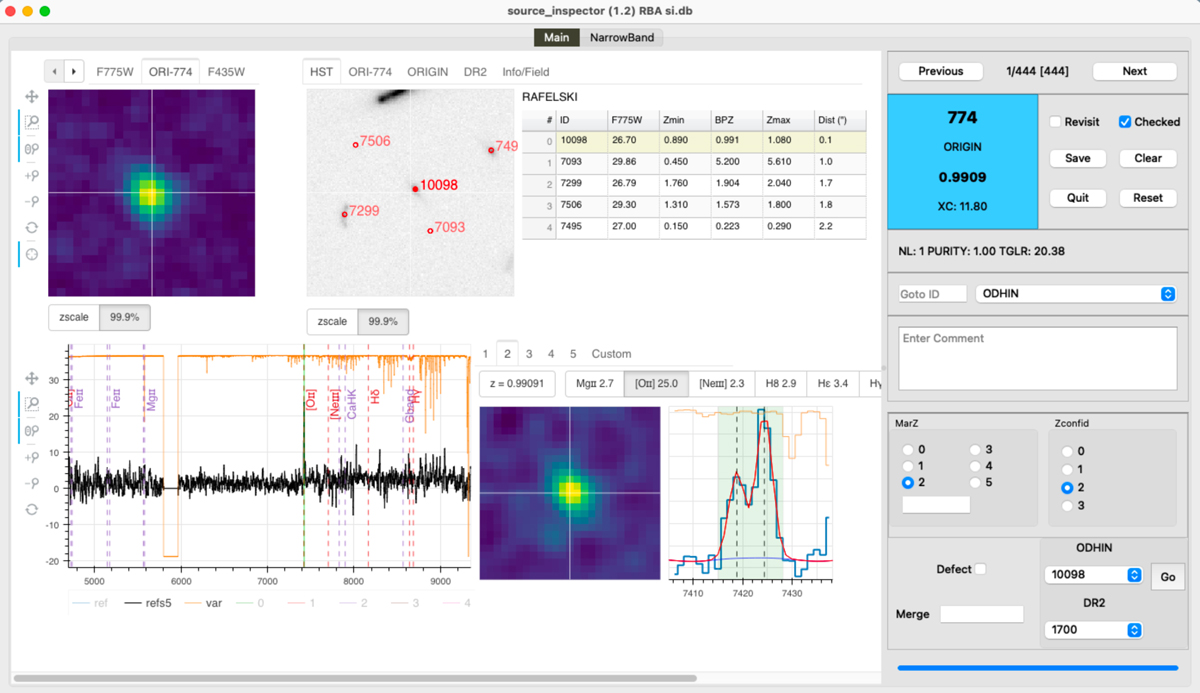
Fig. 19.
Download original image
SourceInspector interface in evaluation mode. The left side of the interface displays the interactive html file for the current source. It shows the five redshift solutions proposed by pyMarZ plus their corresponding pyPlatefit line fits and associated narrow bands in the bottom panels. The html upper panels display MUSE and HST images, and the locations of neighboring sources from HST catalogs. The right side of the interface allows the user to navigate in the source list, select the redshift solution or assign a new redshift, assign confidence and provide crossmatch information.
Current usage metrics show cumulative count of Article Views (full-text article views including HTML views, PDF and ePub downloads, according to the available data) and Abstracts Views on Vision4Press platform.
Data correspond to usage on the plateform after 2015. The current usage metrics is available 48-96 hours after online publication and is updated daily on week days.
Initial download of the metrics may take a while.