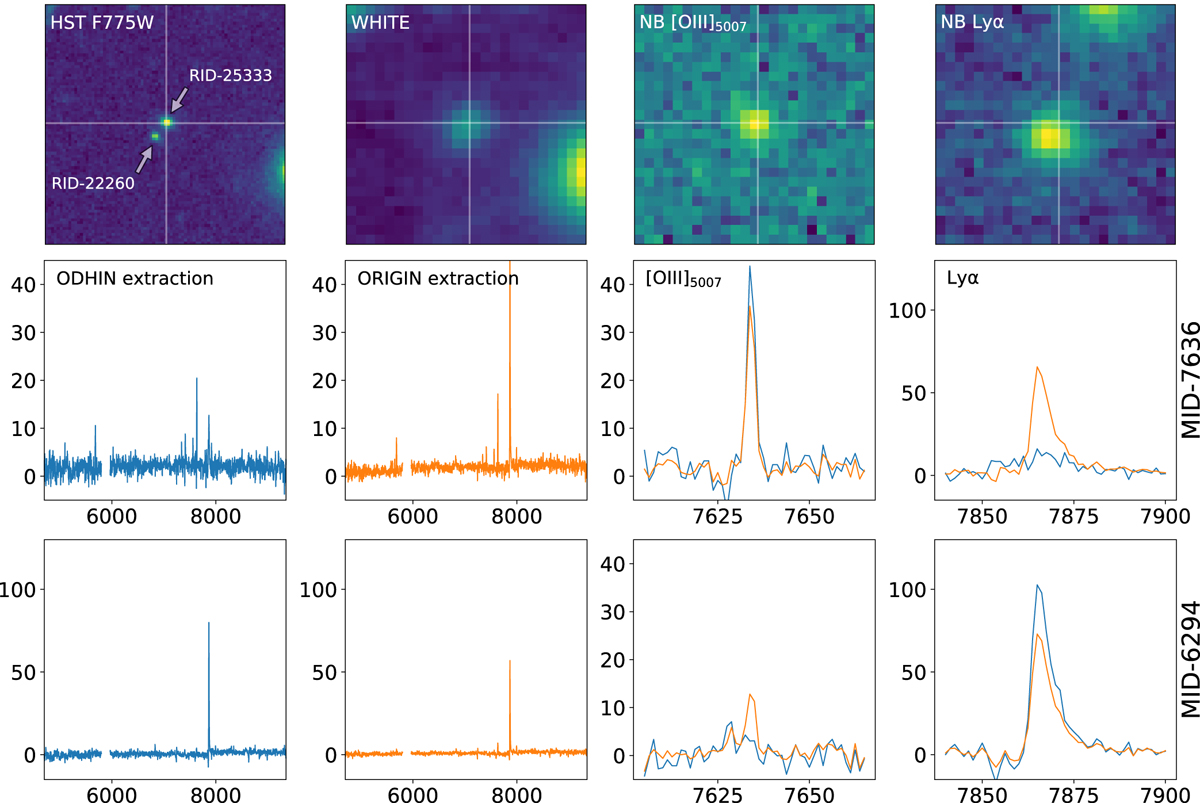
Fig. 17.
Download original image
Example of ODHIN de-blending of two close sources MID-7636 (RID-25333), a z = 0.5 star forming galaxy, and MID-6294 (RID-22260), a z = 5.5 Lyα emitter. The separation of the sources is 0.4 arcsec. The top row of panels shows, from left to right: the HST F775W, MUSE white-light, [OIII]5007 Å and Lyα narrow band images (5 × 5 arcsec2 size). The central and bottom panels display the spectra derived from ODHIN (in blue) and ORIGIN extraction (in orange) for each source. Fluxes and observed wavelengths are expressed in units of 10−20 erg s−1 cm−2 Å−1 and Å, respectively.
Current usage metrics show cumulative count of Article Views (full-text article views including HTML views, PDF and ePub downloads, according to the available data) and Abstracts Views on Vision4Press platform.
Data correspond to usage on the plateform after 2015. The current usage metrics is available 48-96 hours after online publication and is updated daily on week days.
Initial download of the metrics may take a while.