Fig. 16.
Download original image
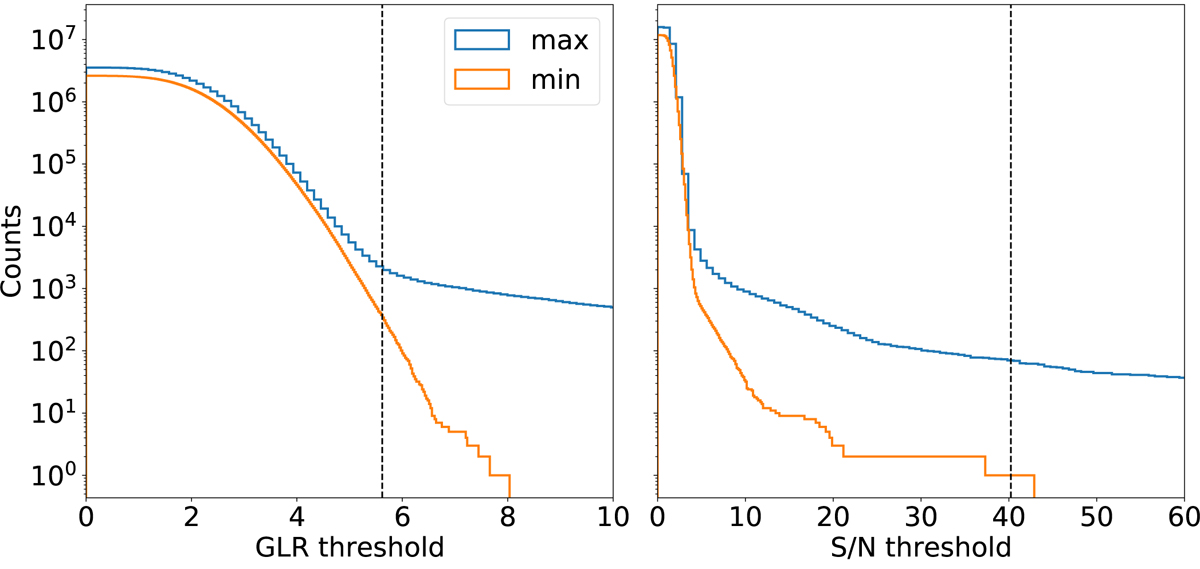
Counts of positive and negative local maxima in the GLR datacube as a function of the threshold are shown in the left panel in blue and orange, respectively. The GLR threshold value computed to achieve the target purity value of 0.8 is displayed as a dotted vertical line. A similar plot for the S/N datacube and a target purity of 0.90 is shown on the right panel.
Current usage metrics show cumulative count of Article Views (full-text article views including HTML views, PDF and ePub downloads, according to the available data) and Abstracts Views on Vision4Press platform.
Data correspond to usage on the plateform after 2015. The current usage metrics is available 48-96 hours after online publication and is updated daily on week days.
Initial download of the metrics may take a while.