Open Access
Fig. 15.
Download original image
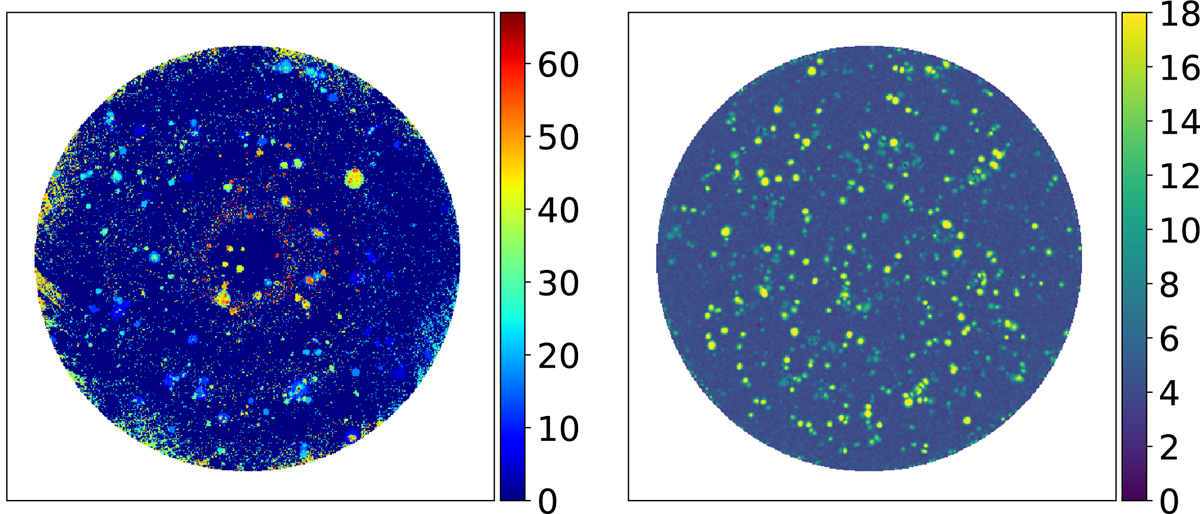
Number of iterations where each spaxel was involved in the iterative PCA is shown in the left panel. The ORIGIN maxmap, computed as the maximum of the General Likehood Ratio test datacube over the wavelength axis, is displayed in the right panel.
Current usage metrics show cumulative count of Article Views (full-text article views including HTML views, PDF and ePub downloads, according to the available data) and Abstracts Views on Vision4Press platform.
Data correspond to usage on the plateform after 2015. The current usage metrics is available 48-96 hours after online publication and is updated daily on week days.
Initial download of the metrics may take a while.