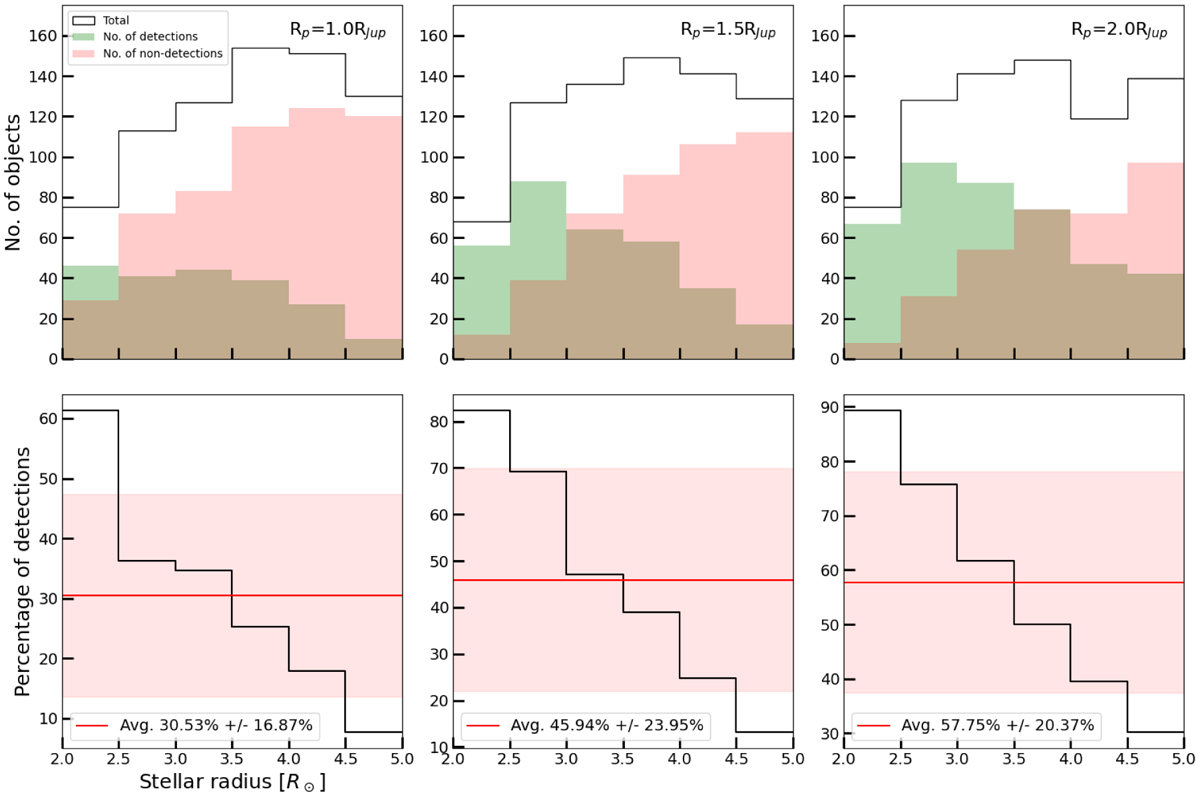
Fig. 2
Download original image
Results from the injecting artificial transit test. Top row: result for injected planets with radius Rp = 1.0 RJup (left), for planets with radius Rp = 1.5 RJup (middle), and for planets with radius Rp = 2.0 RJup (right). The green shaded areas shows the correctly detected artificial transits for different stellar radii, while the red shaded areas show the non-detections. The black line shows the total number of injected planets for the different stellar radii. Bottom row: percentages of correctly detected artificial transits for stellar radii in the range 2. R⊙ ≤ R ≤ 5 R⊙. The red line indicates the average percentage and the red shaded area indicates the 1σ errors.
Current usage metrics show cumulative count of Article Views (full-text article views including HTML views, PDF and ePub downloads, according to the available data) and Abstracts Views on Vision4Press platform.
Data correspond to usage on the plateform after 2015. The current usage metrics is available 48-96 hours after online publication and is updated daily on week days.
Initial download of the metrics may take a while.