Fig. 1
Download original image
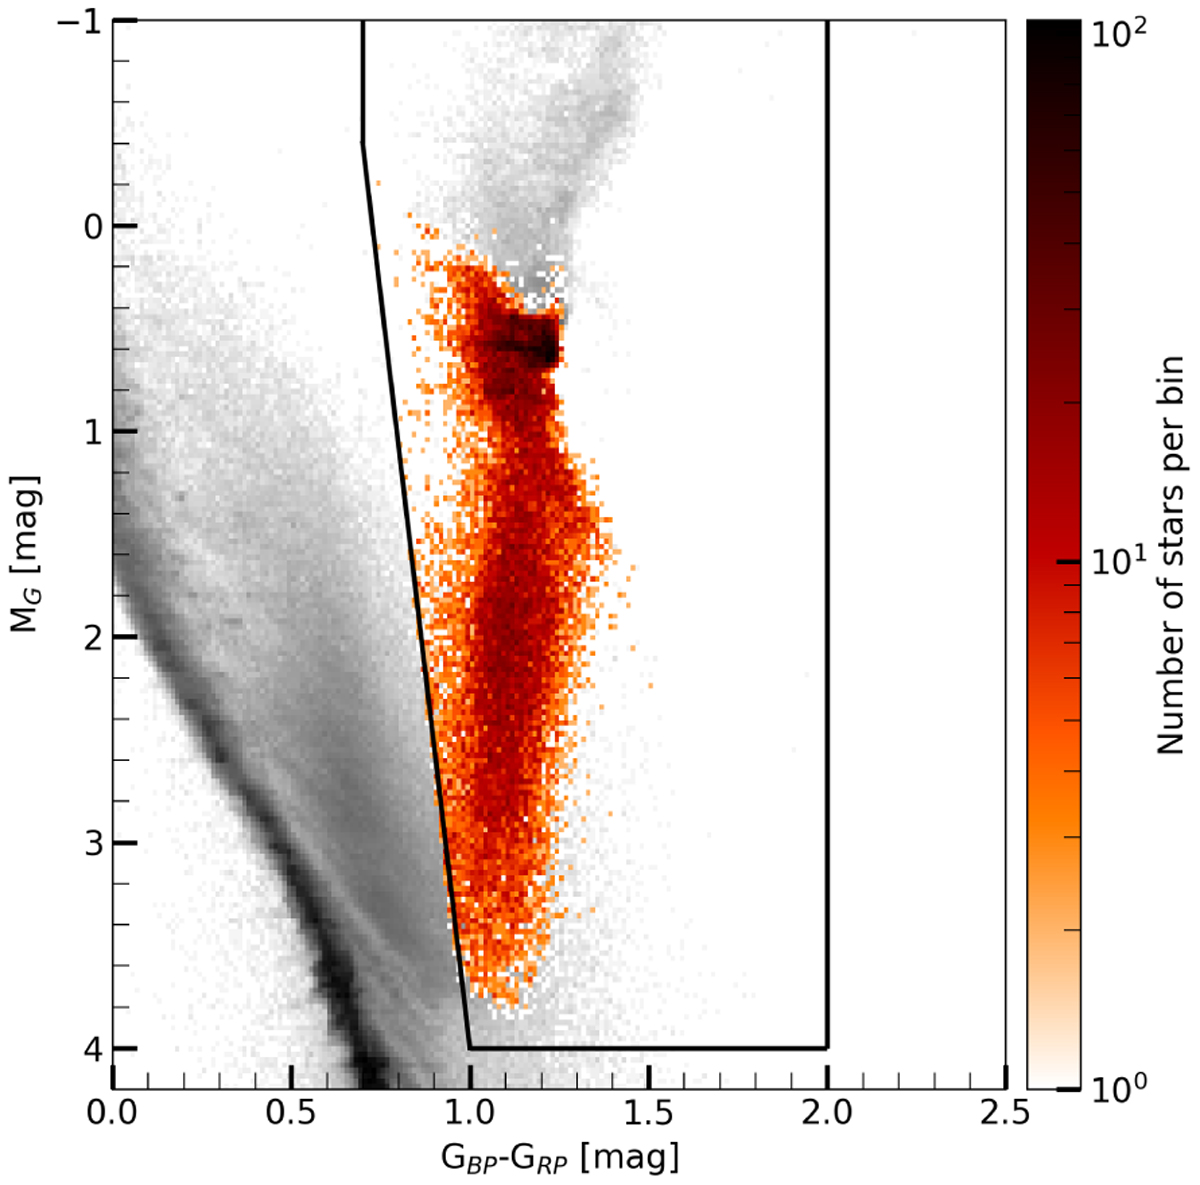
Colour-magnitude diagram of stars that have survived the imposed selection criteria. The black box represents the boundaries of the region enclosing the RGB. The colour (GBP − GRP) of the stars can be found on the x-axis, while the y-axis denotes the absolute magnitudes. The logarithmic colour map indicates the number of stars in each two-dimensional bin. Stars removed by the selection criteria are shown in grey.
Current usage metrics show cumulative count of Article Views (full-text article views including HTML views, PDF and ePub downloads, according to the available data) and Abstracts Views on Vision4Press platform.
Data correspond to usage on the plateform after 2015. The current usage metrics is available 48-96 hours after online publication and is updated daily on week days.
Initial download of the metrics may take a while.