Fig. 12
Download original image
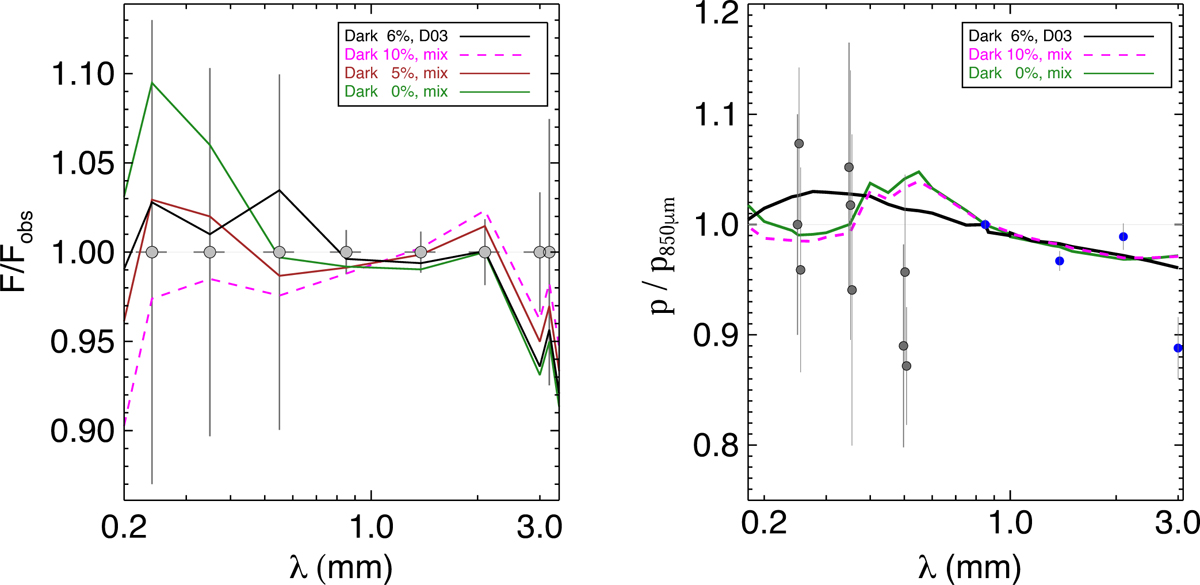
As Fig. 11 for a 97:3 mix in mass of the MgO−0.5 SiO2 (X50A) and ![]() (E20R) of the Demyk et al. (2022) samples. The model with a contribution to the total dust mass of 0 (green), 5% (brown), and 10% (magenta) of dark dust is shown. The best-fit using the Draine (2003) optical constants and the parameters of Table 1 for the
(E20R) of the Demyk et al. (2022) samples. The model with a contribution to the total dust mass of 0 (green), 5% (brown), and 10% (magenta) of dark dust is shown. The best-fit using the Draine (2003) optical constants and the parameters of Table 1 for the ![]() µm model (black) is shown for comparison.
µm model (black) is shown for comparison.
Current usage metrics show cumulative count of Article Views (full-text article views including HTML views, PDF and ePub downloads, according to the available data) and Abstracts Views on Vision4Press platform.
Data correspond to usage on the plateform after 2015. The current usage metrics is available 48-96 hours after online publication and is updated daily on week days.
Initial download of the metrics may take a while.