Fig. 3
Download original image
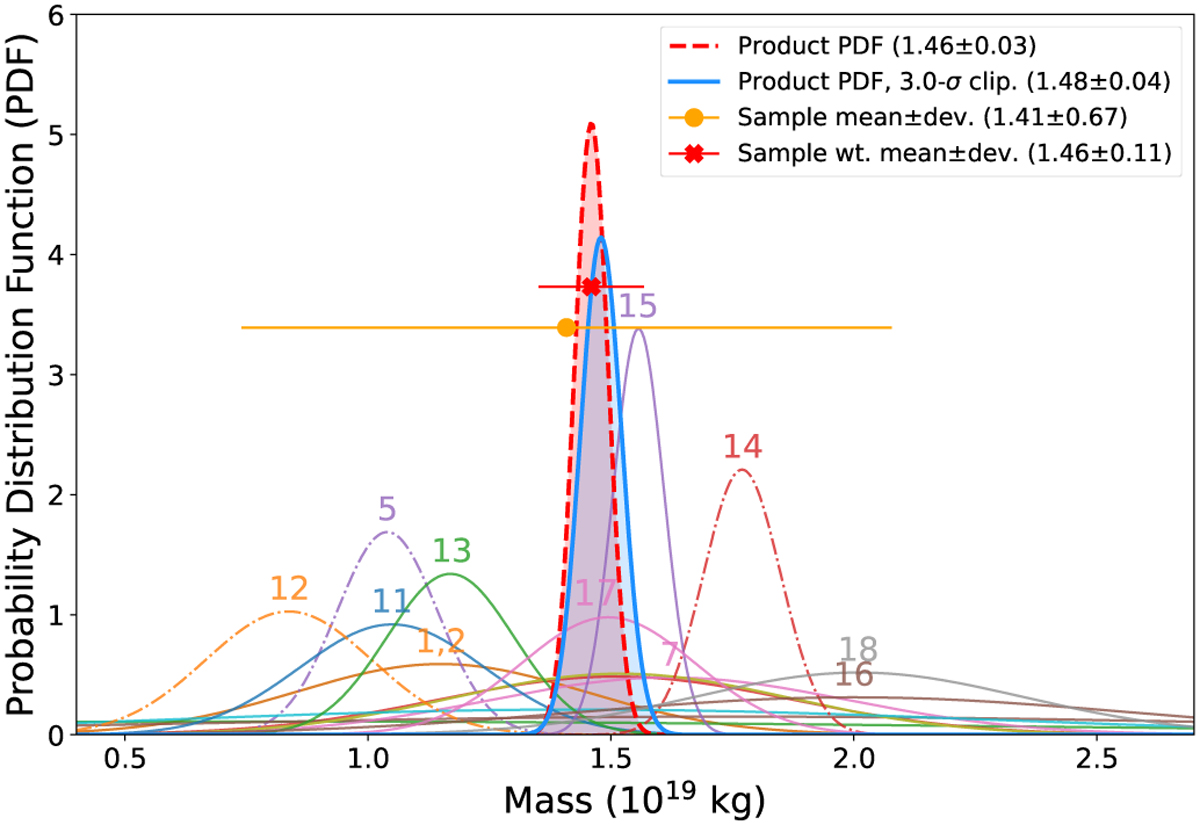
Mass measurements of (65) Cybele from Table 2 converted to Gaussian probability distribution functions (PDFs). Numbers correspond to references listed in the table (only a subset of reference numbers is displayed for improved readability). The adopted mass estimate was obtained by computing the product PDF as described in Sect. 4.2. Continuous lines indicate measurements used to compute the mass estimate, and dashed lines correspond to discarded measurements. The filled curves are the product PDFs before (dashed red) and after (blue) rejection of the discarded measurements. The orange and red circles show the unweighted and weighted sample averages and standard deviations, respectively.
Current usage metrics show cumulative count of Article Views (full-text article views including HTML views, PDF and ePub downloads, according to the available data) and Abstracts Views on Vision4Press platform.
Data correspond to usage on the plateform after 2015. The current usage metrics is available 48-96 hours after online publication and is updated daily on week days.
Initial download of the metrics may take a while.