Fig. 1
Download original image
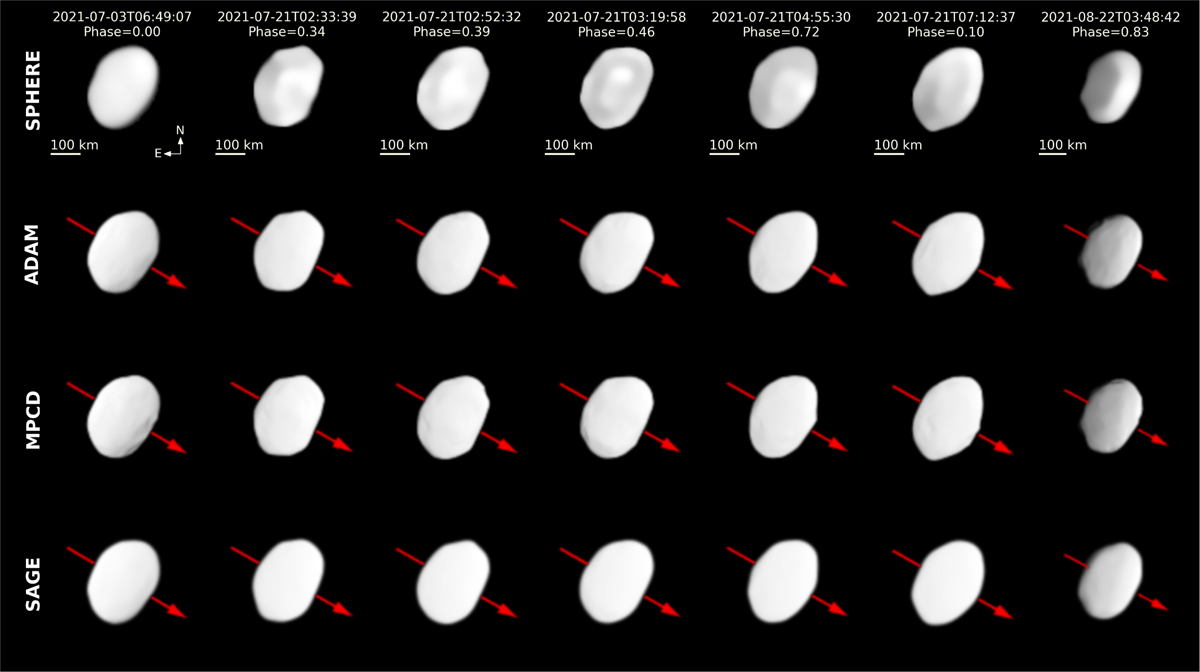
Comparison between the deconvolved images of (65) Cybele (top row) and the corresponding synthetic images generated by the OASIS tool (Jorda et al. 2010) of the ADAM, MPCD, and SAGE shape models. The red arrows indicate the direction of the spin axis. Observing conditions for the images are listed in Appendix A. Residuals between the observed and synthetic images are shown in Appendix D.
Current usage metrics show cumulative count of Article Views (full-text article views including HTML views, PDF and ePub downloads, according to the available data) and Abstracts Views on Vision4Press platform.
Data correspond to usage on the plateform after 2015. The current usage metrics is available 48-96 hours after online publication and is updated daily on week days.
Initial download of the metrics may take a while.